
Jason Gorski
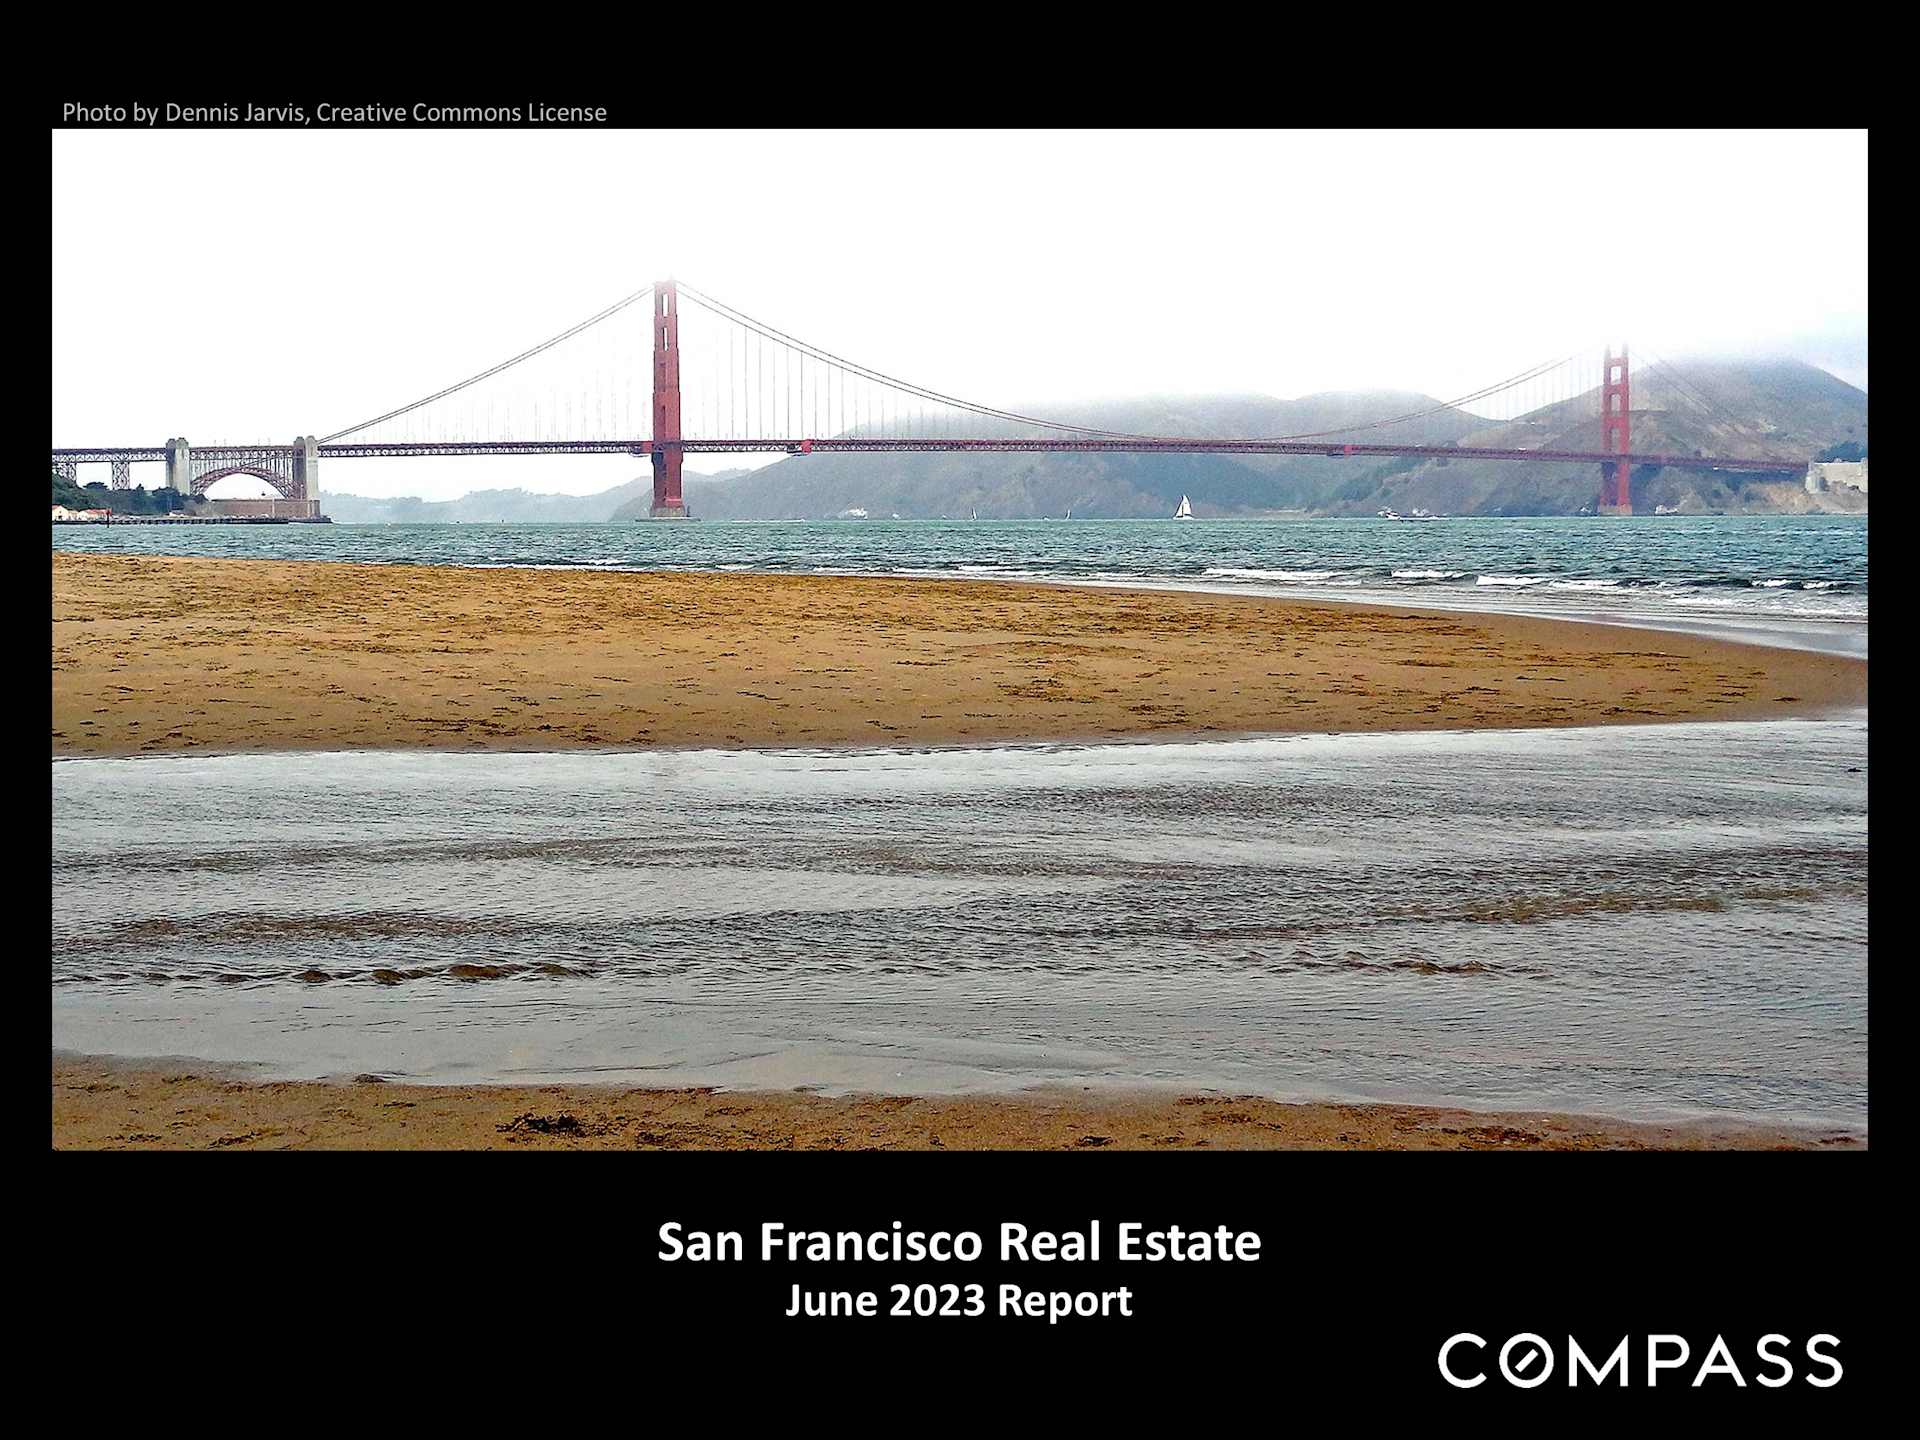
Golden Gate Bridge viewed across a sandy beach, with fog-covered hills and shallow water in the foreground.

San Francisco June 2023 Market Report

San Francisco Real Estate June 2023 Report cover, featuring the Golden Gate Bridge from a beach.

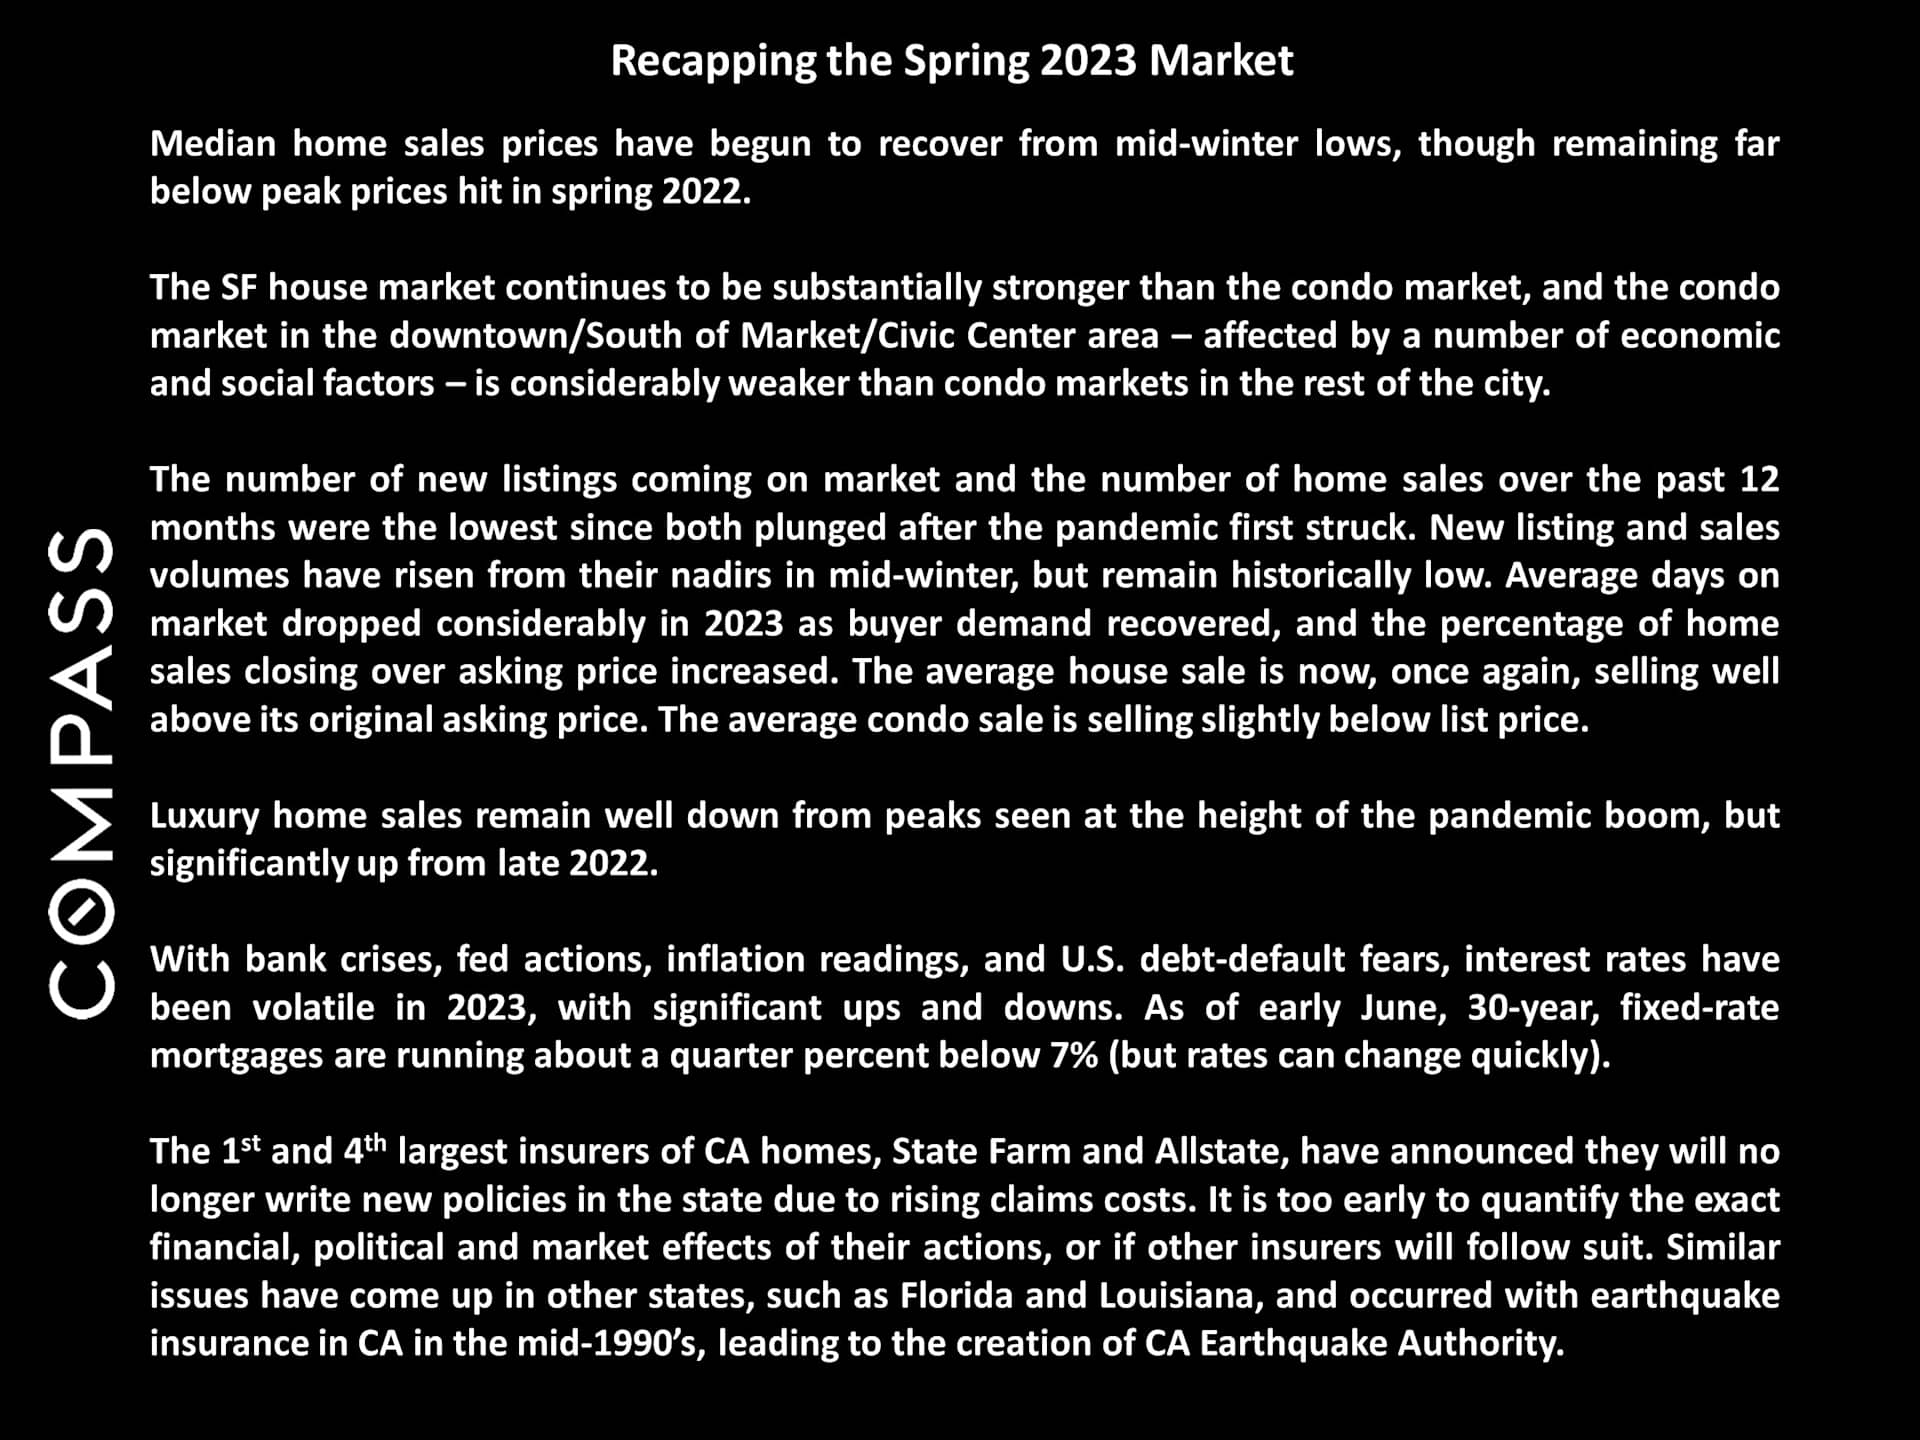
Spring 2023 San Francisco market recap covering home prices, sales, mortgage rates, and insurance.

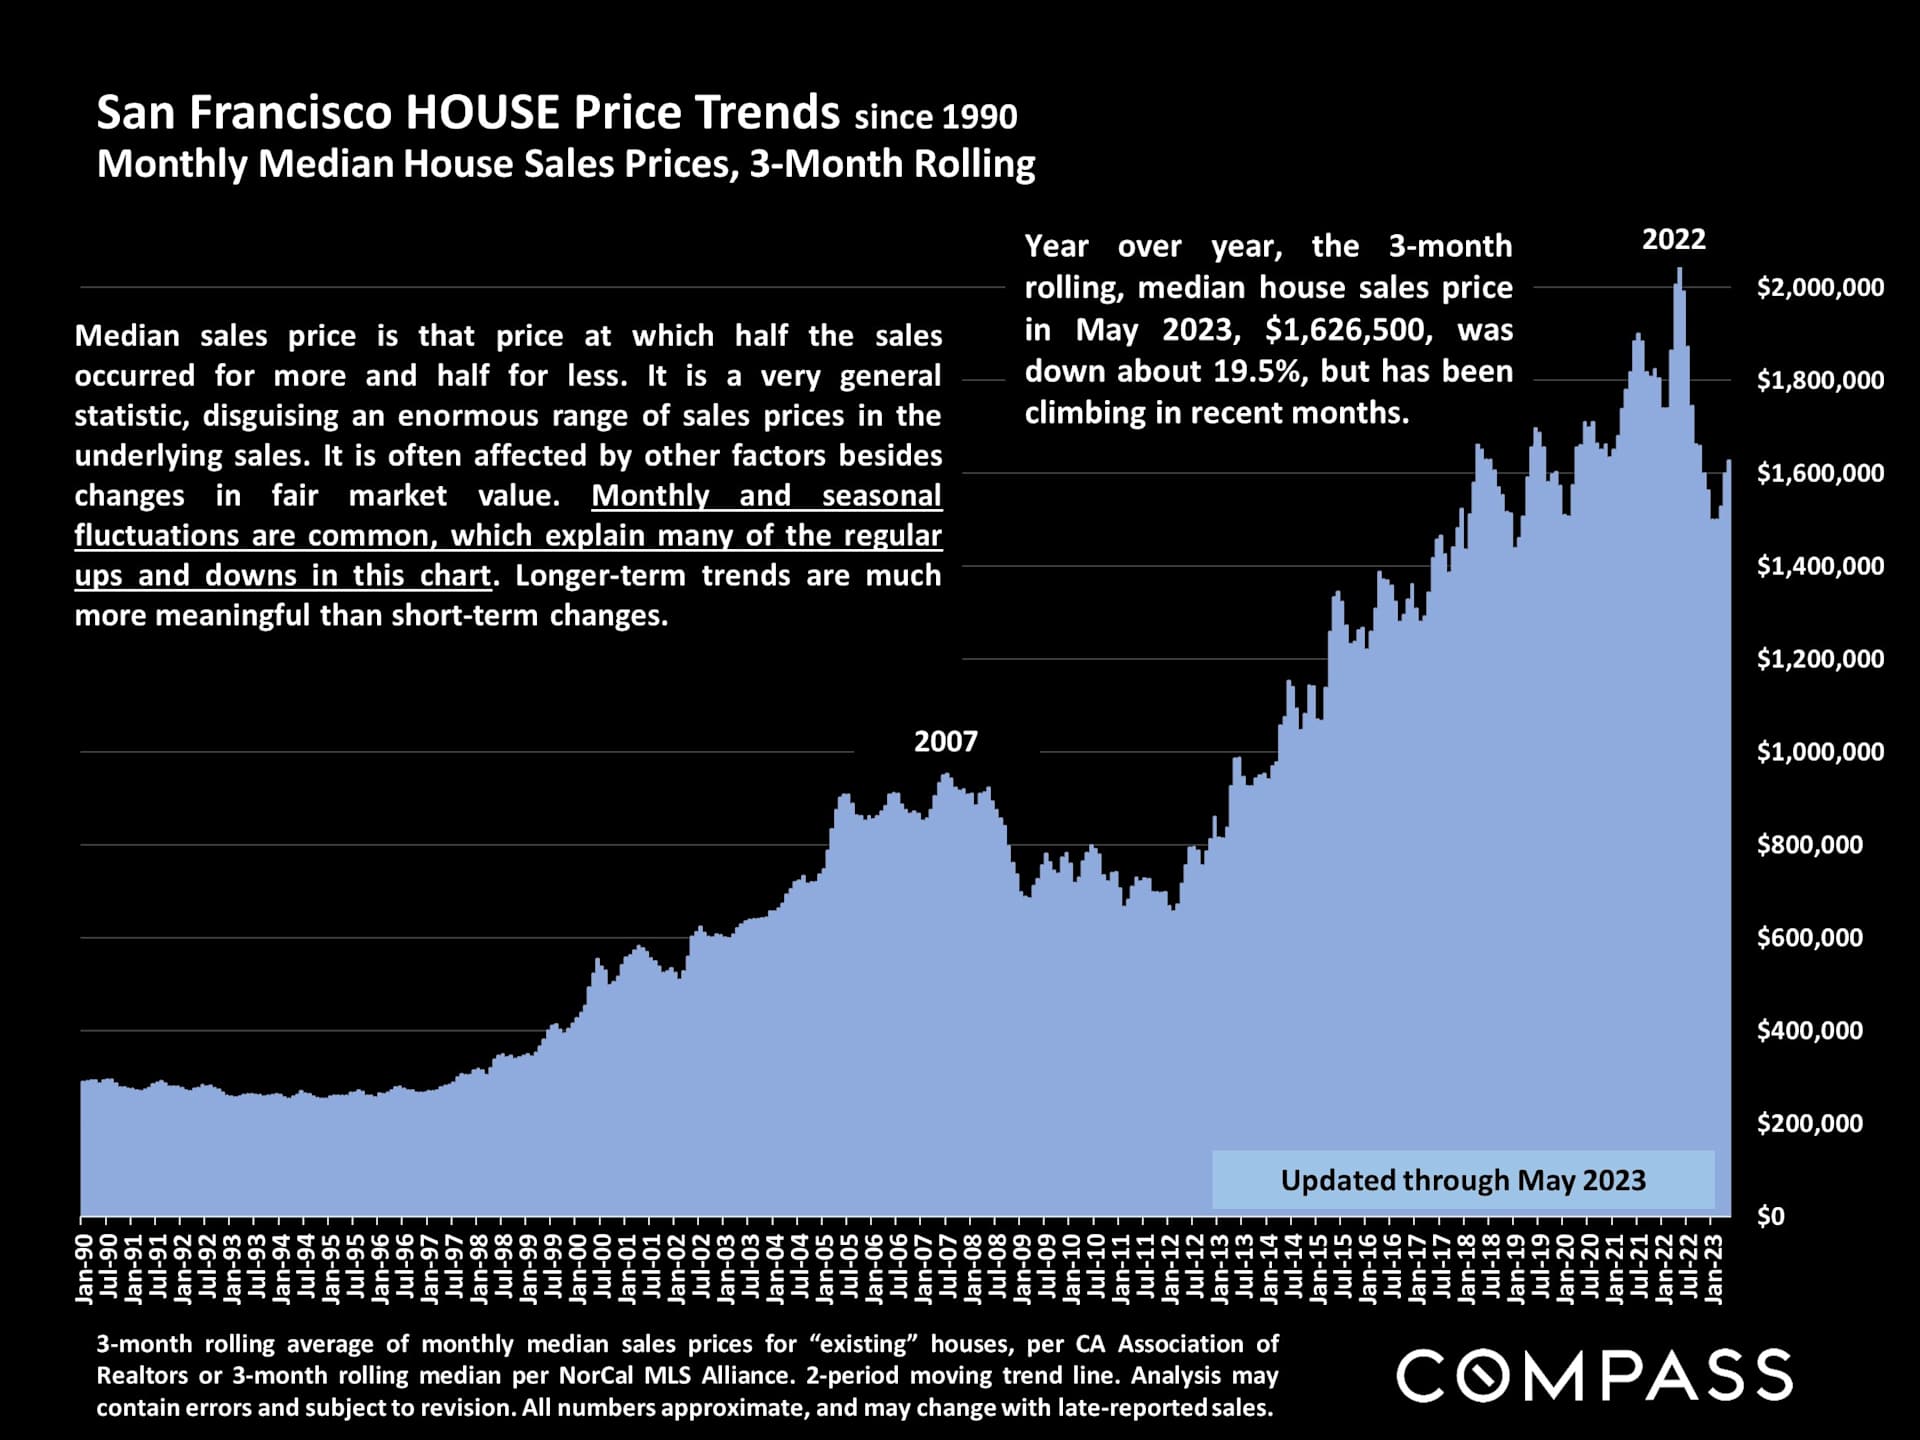
Chart of San Francisco median house prices since 1990, with a three-month rolling trend updated through May 2023.

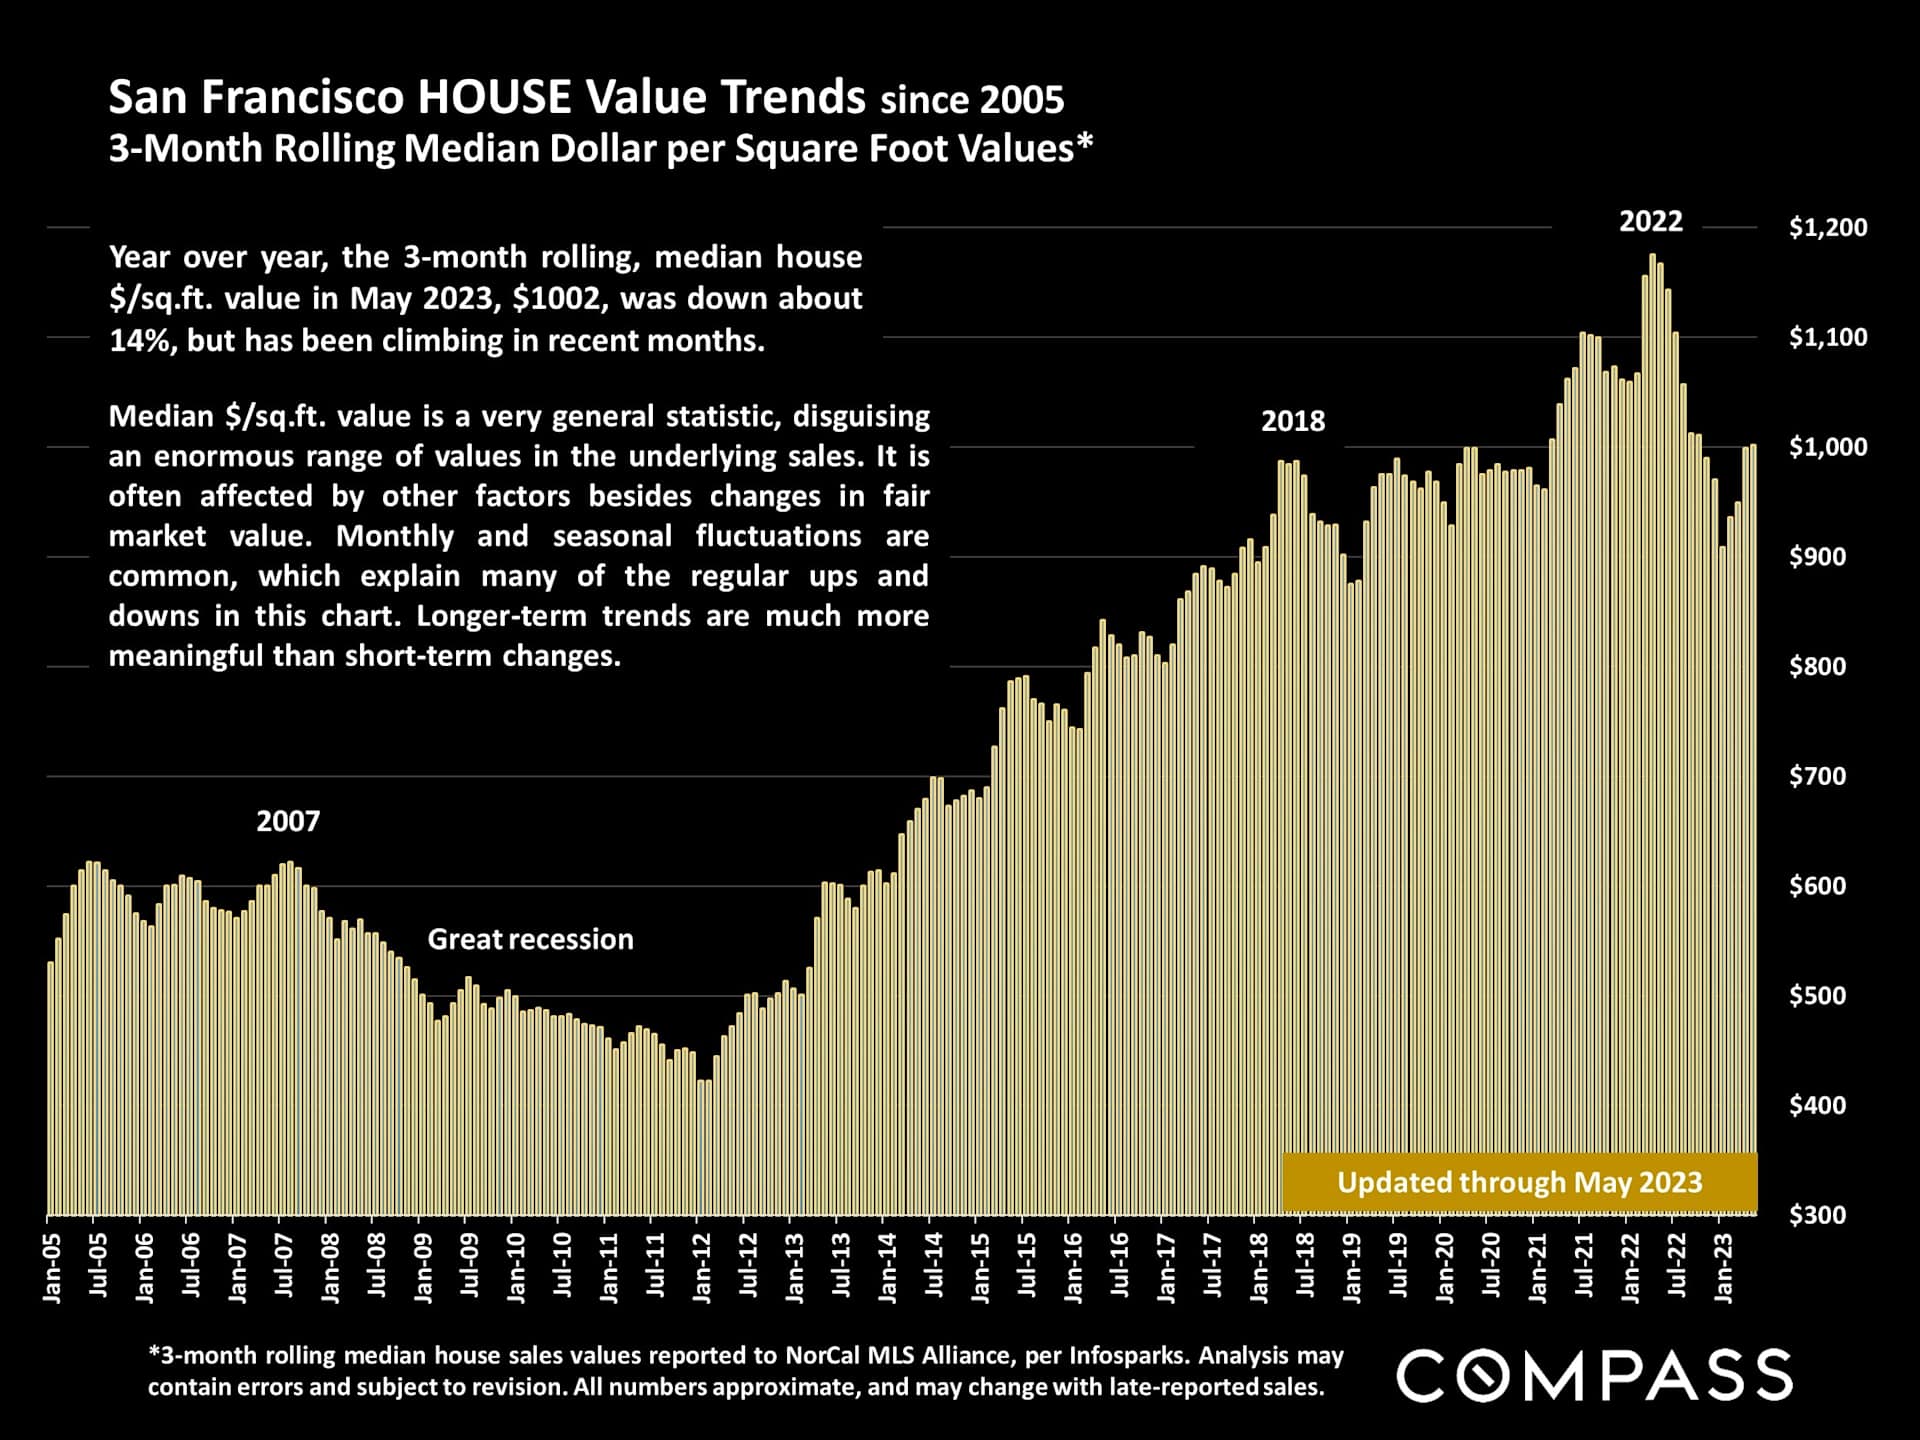
Chart of San Francisco median house value per square foot, showing a 2022 peak and May 2023 value of $1,002.

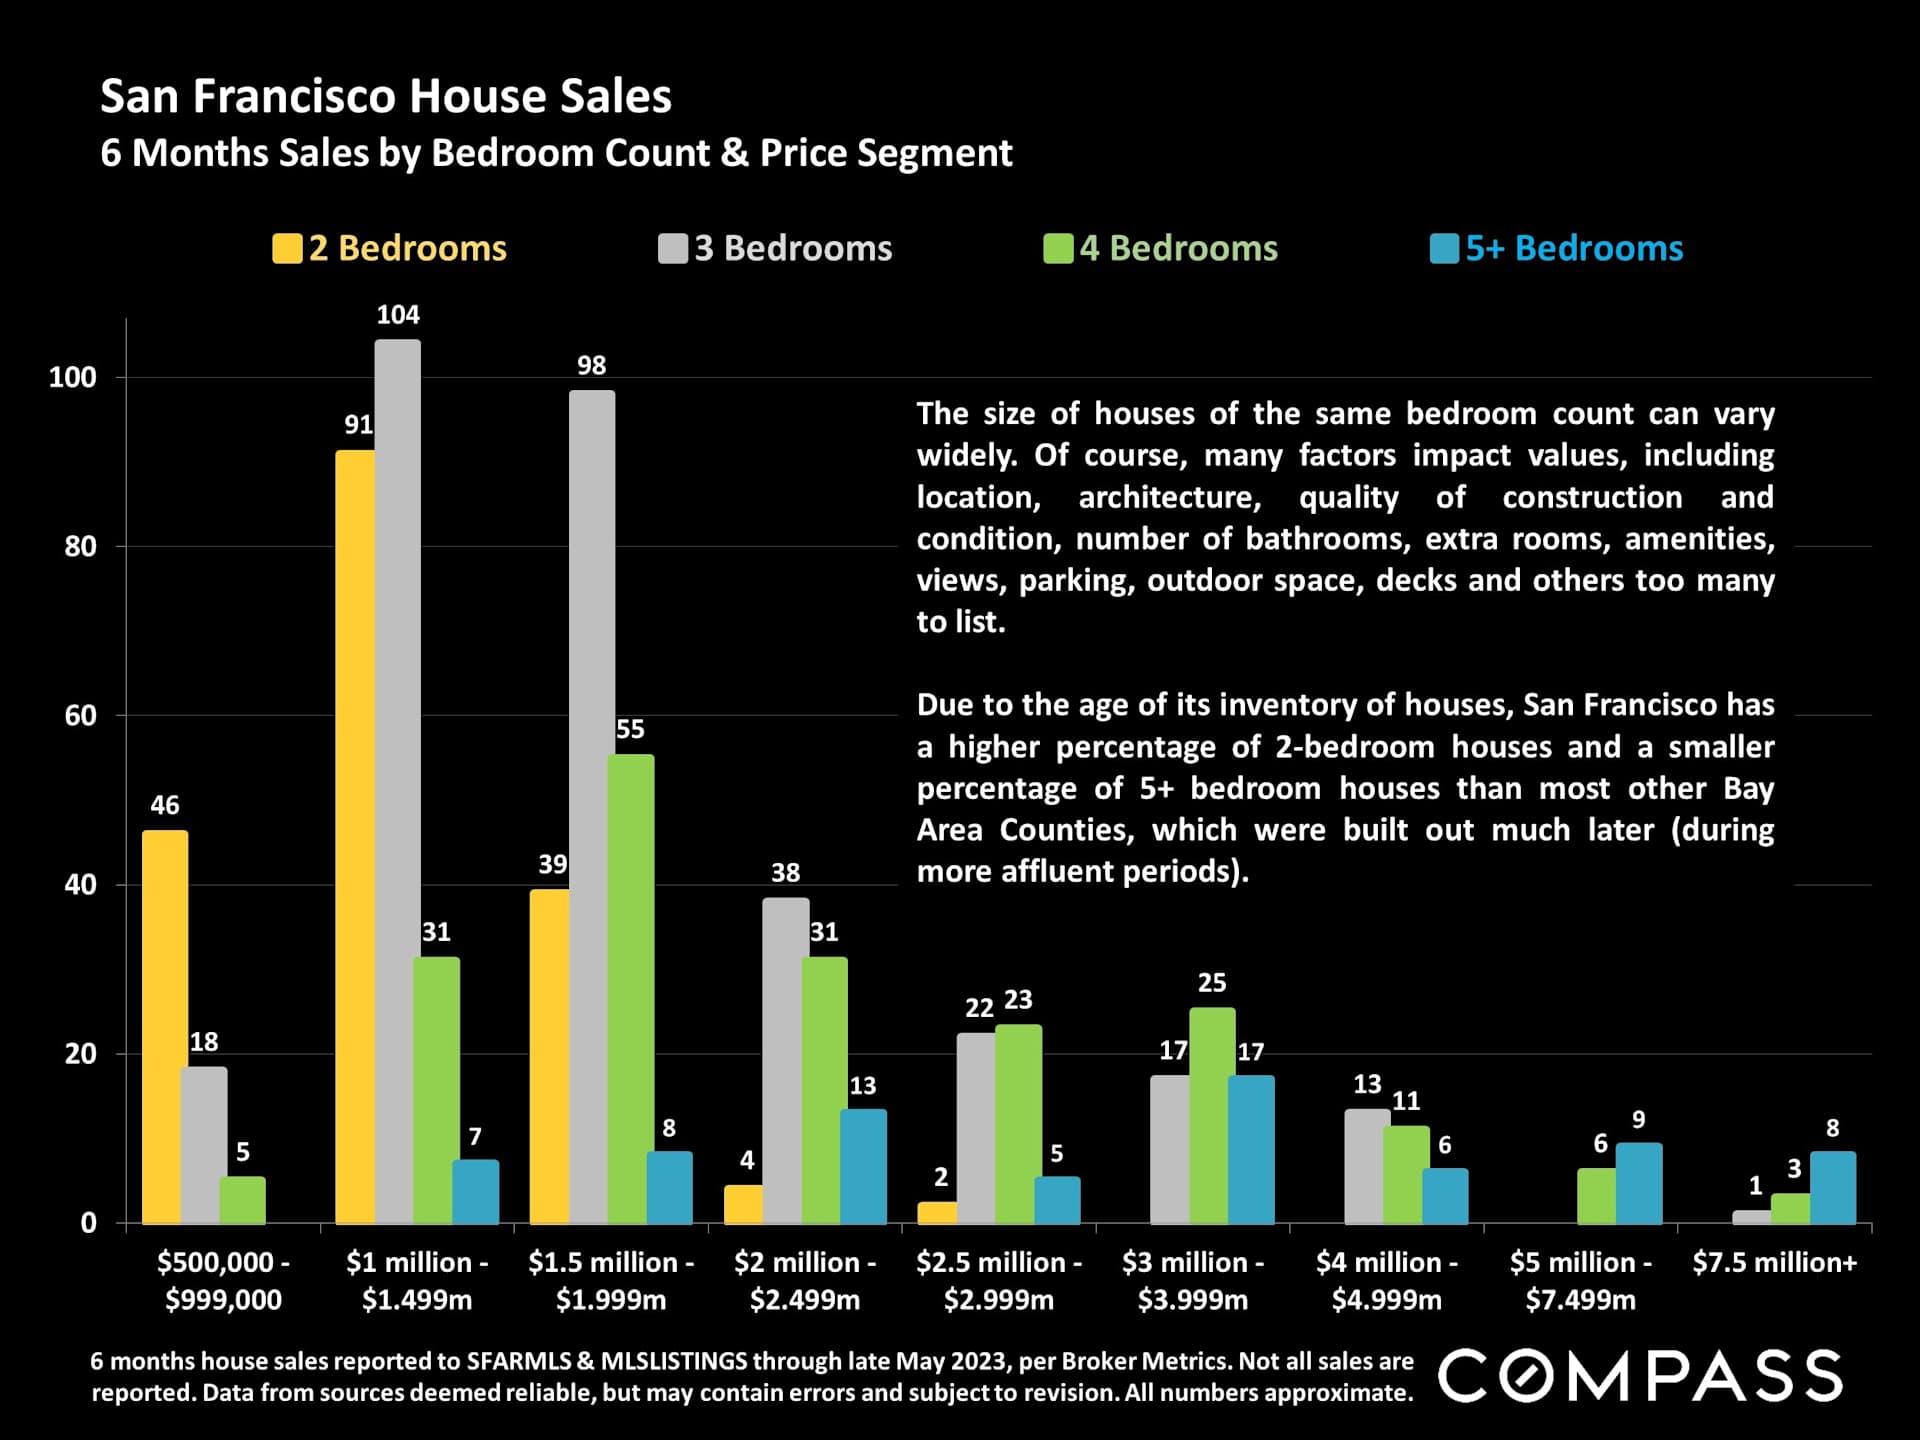
Chart comparing San Francisco house sales by bedroom count and price segment over six months.

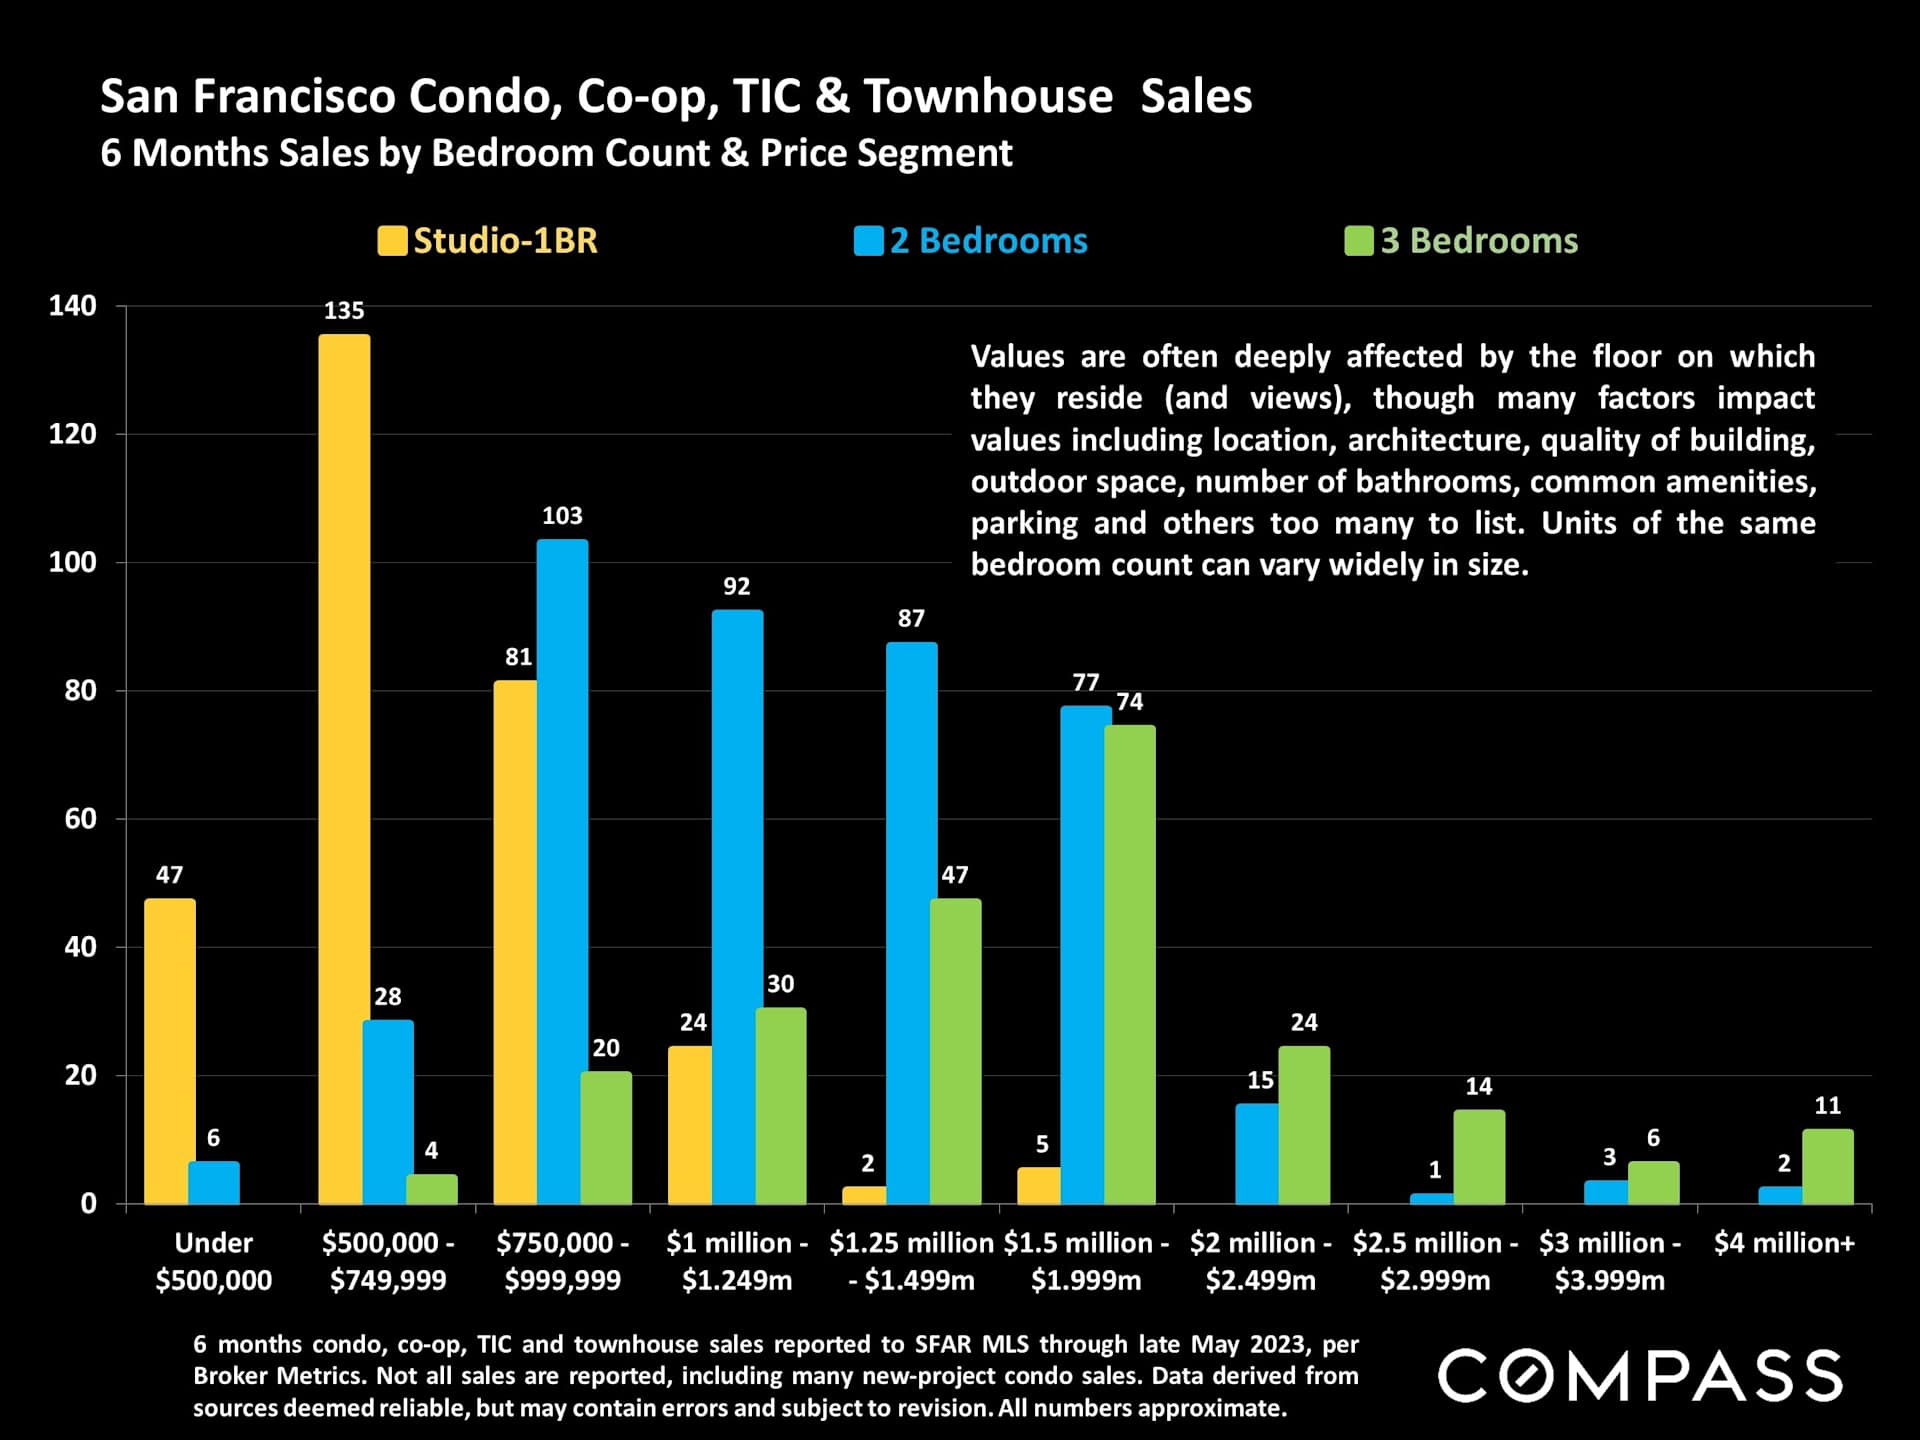
Bar chart of six months of San Francisco condo, co-op, TIC, and townhouse sales by bedroom count and price segment.

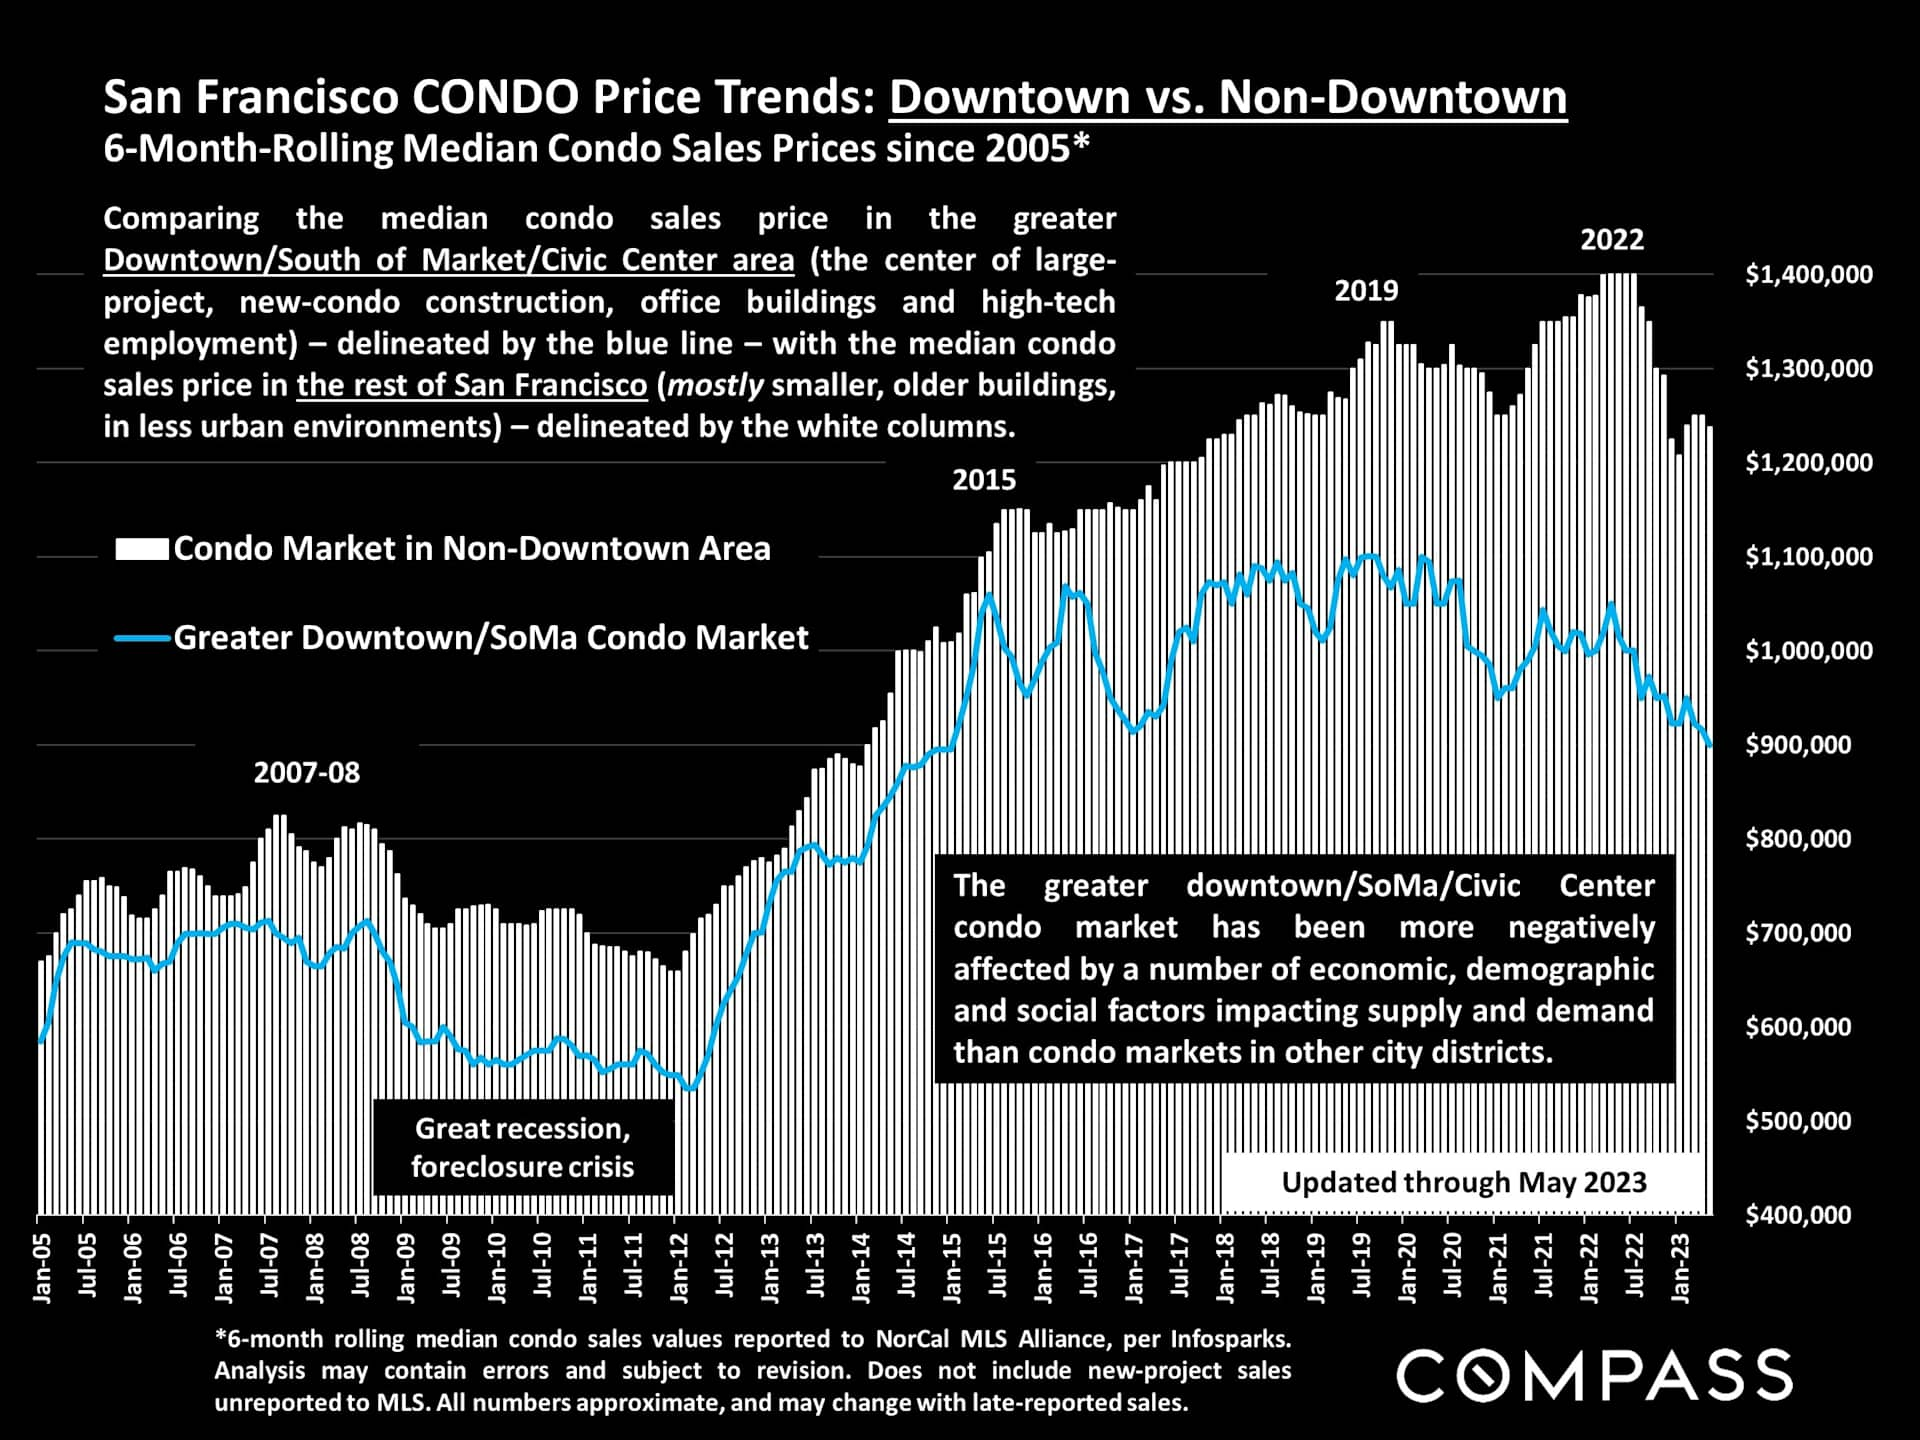
Chart comparing San Francisco condo prices downtown and elsewhere from 2005 through May 2023.

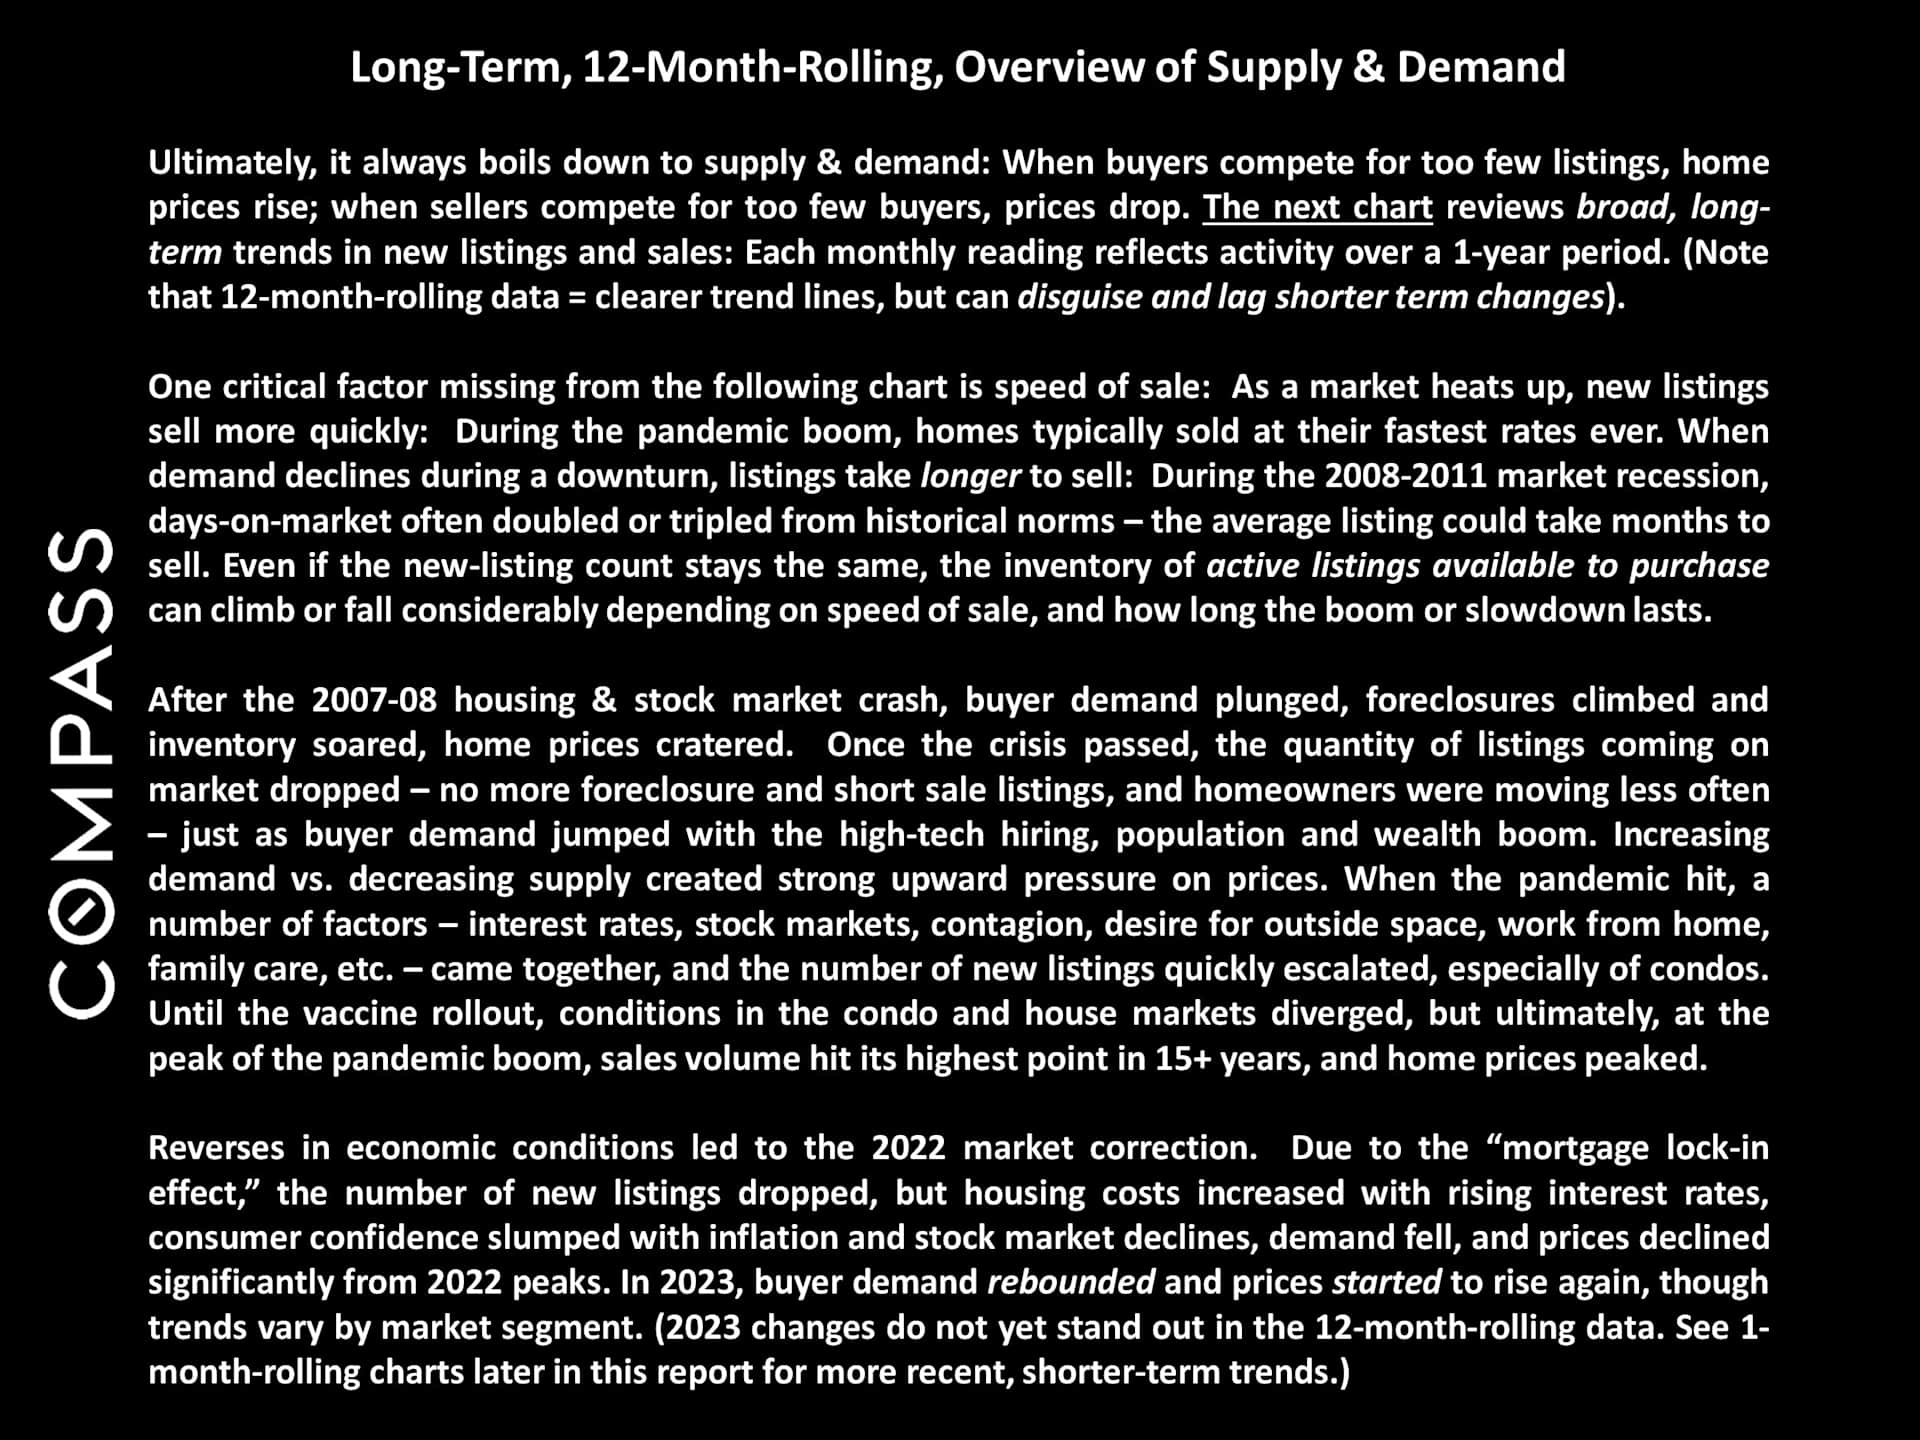
Text panel explaining long-term housing supply, demand, and market trends through 2023.

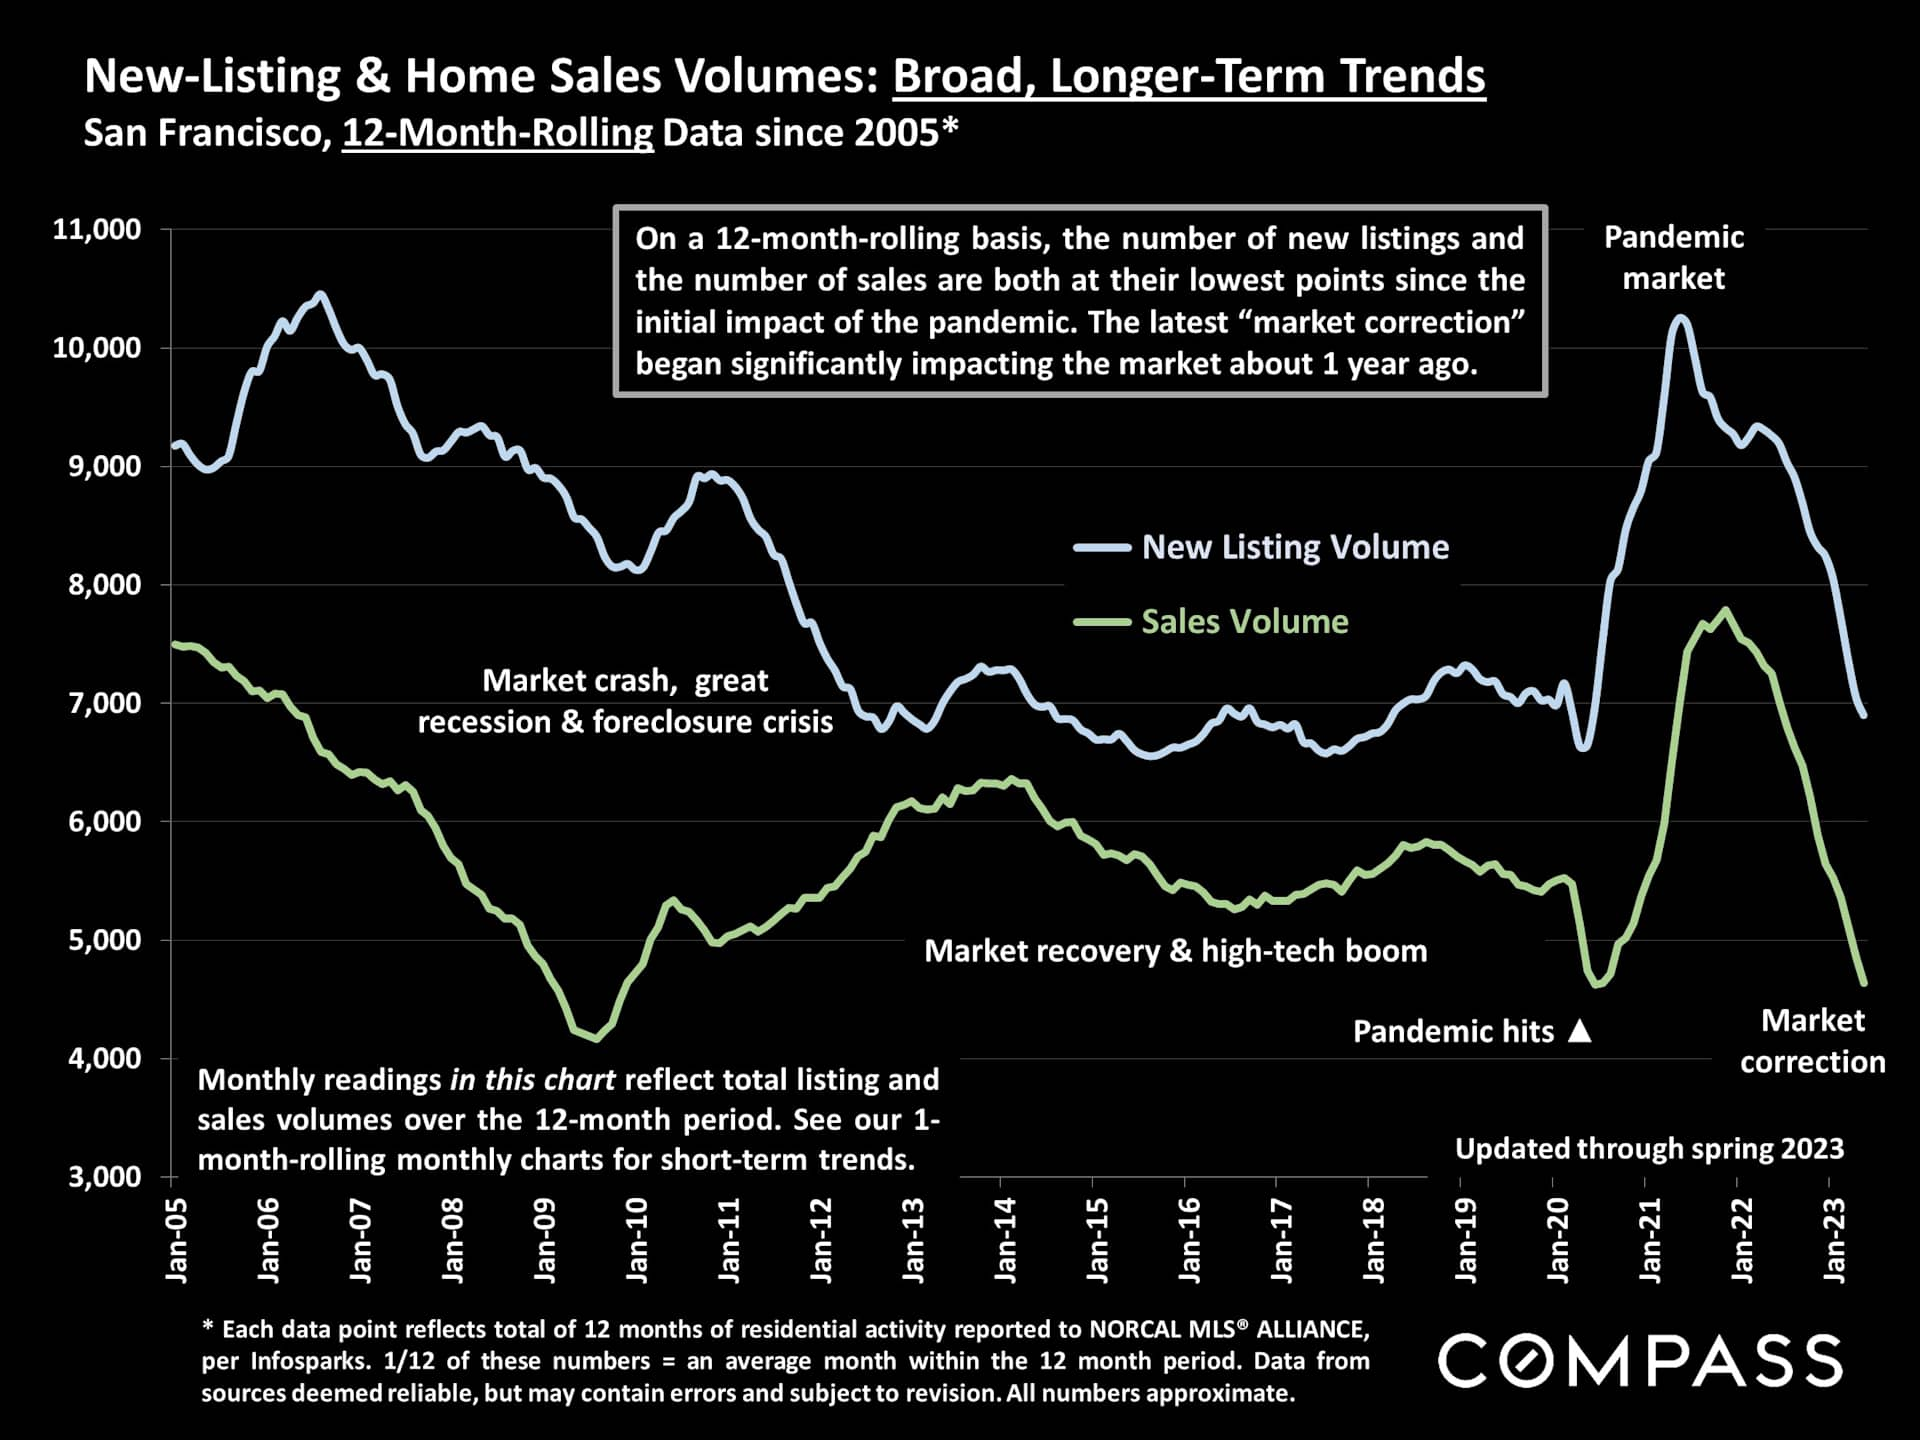
Chart of San Francisco home listings and sales, showing rolling volumes from 2005 to spring 2023.

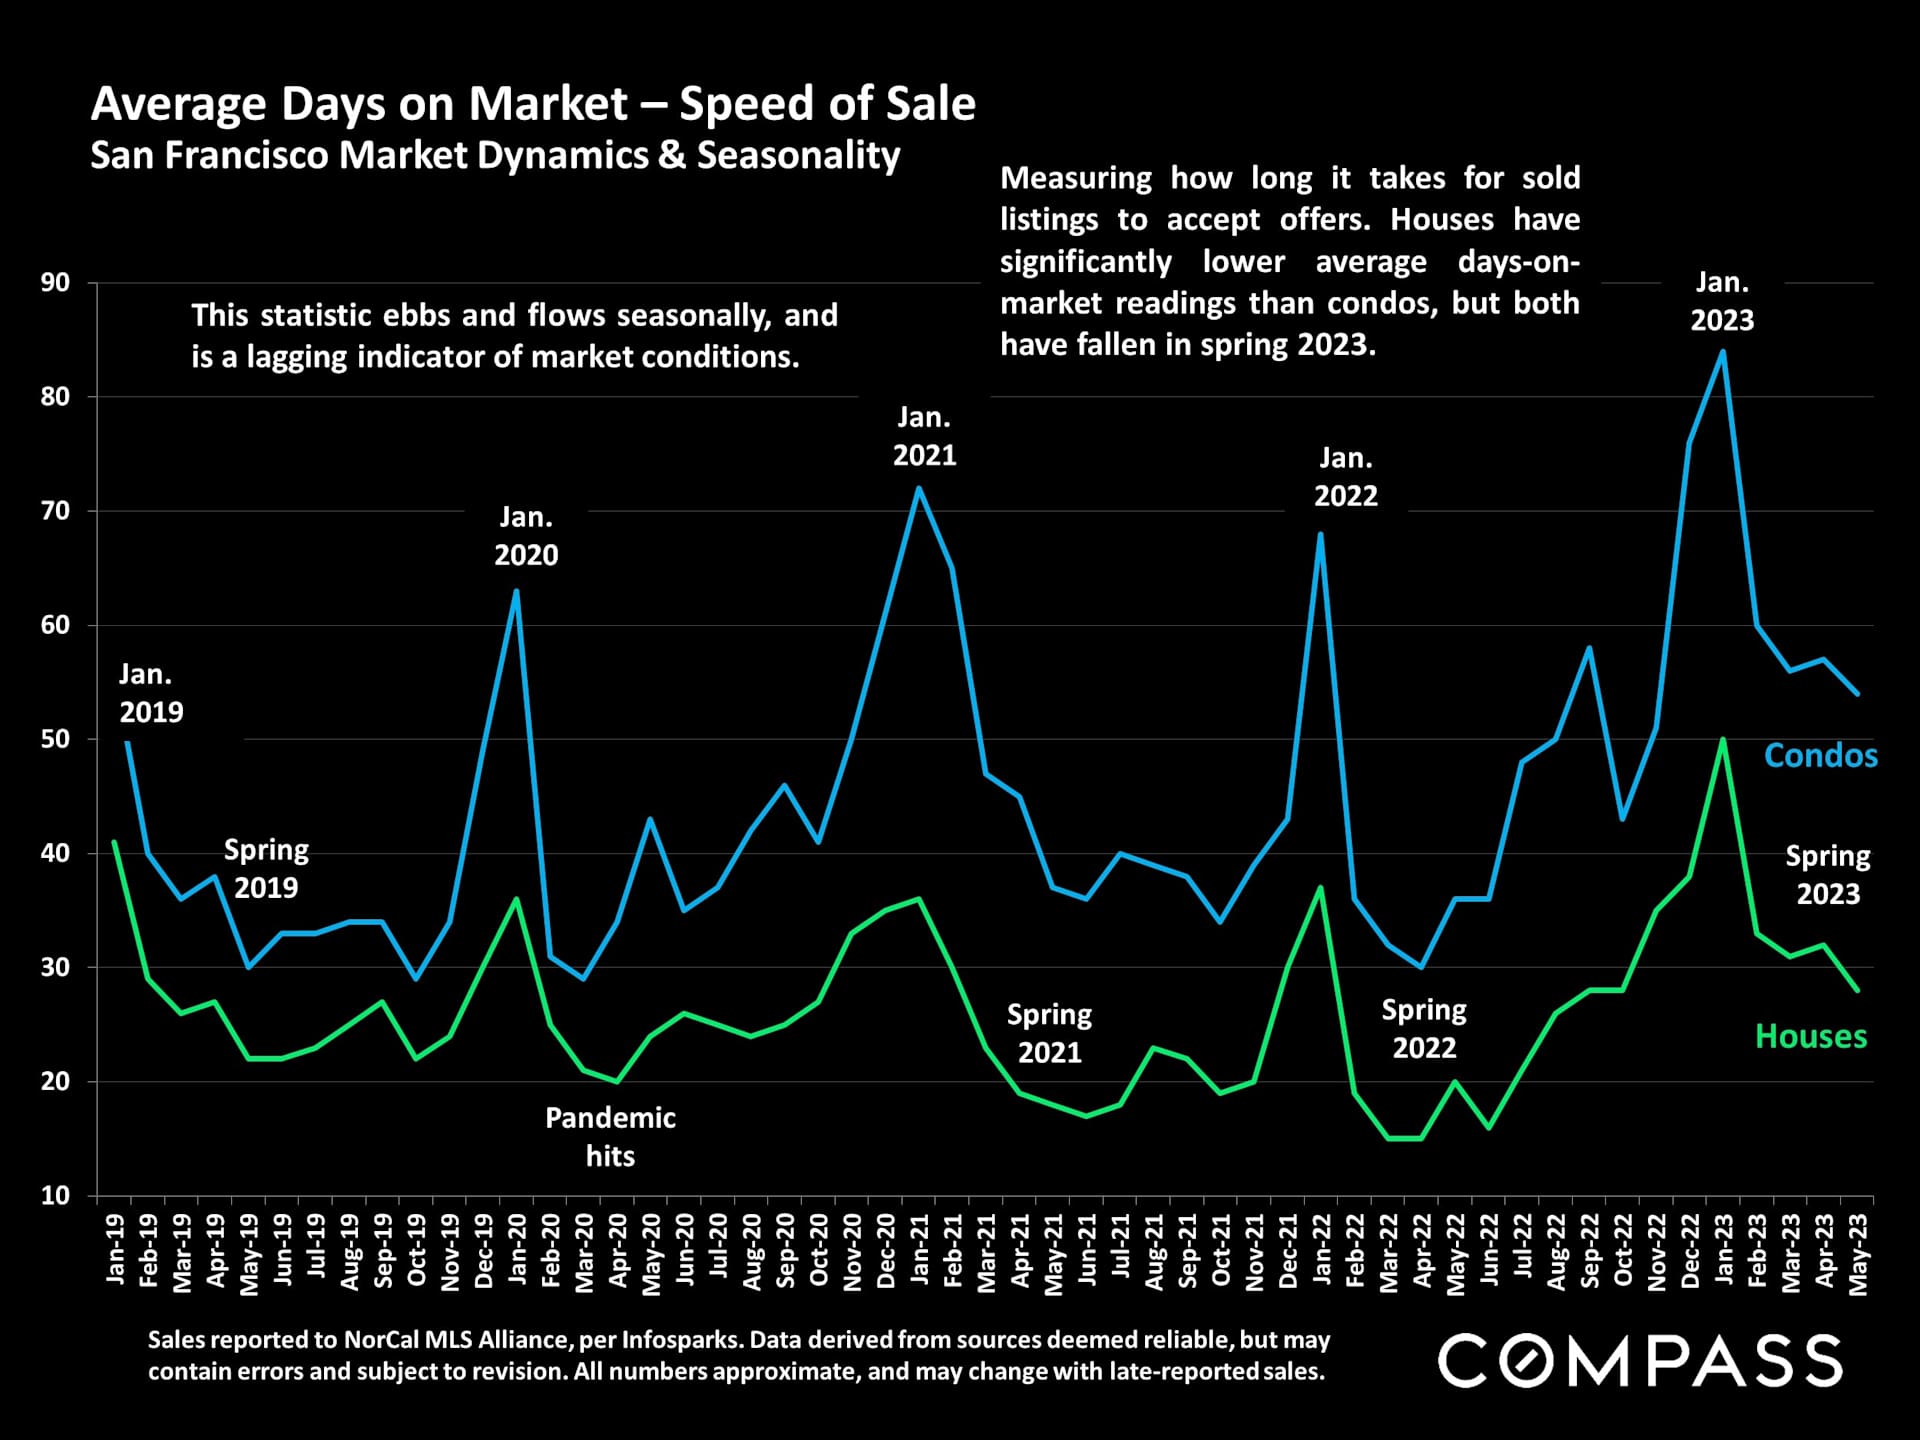
San Francisco days-on-market chart, 2019–2023, comparing condos and houses with both declining in spring 2023.

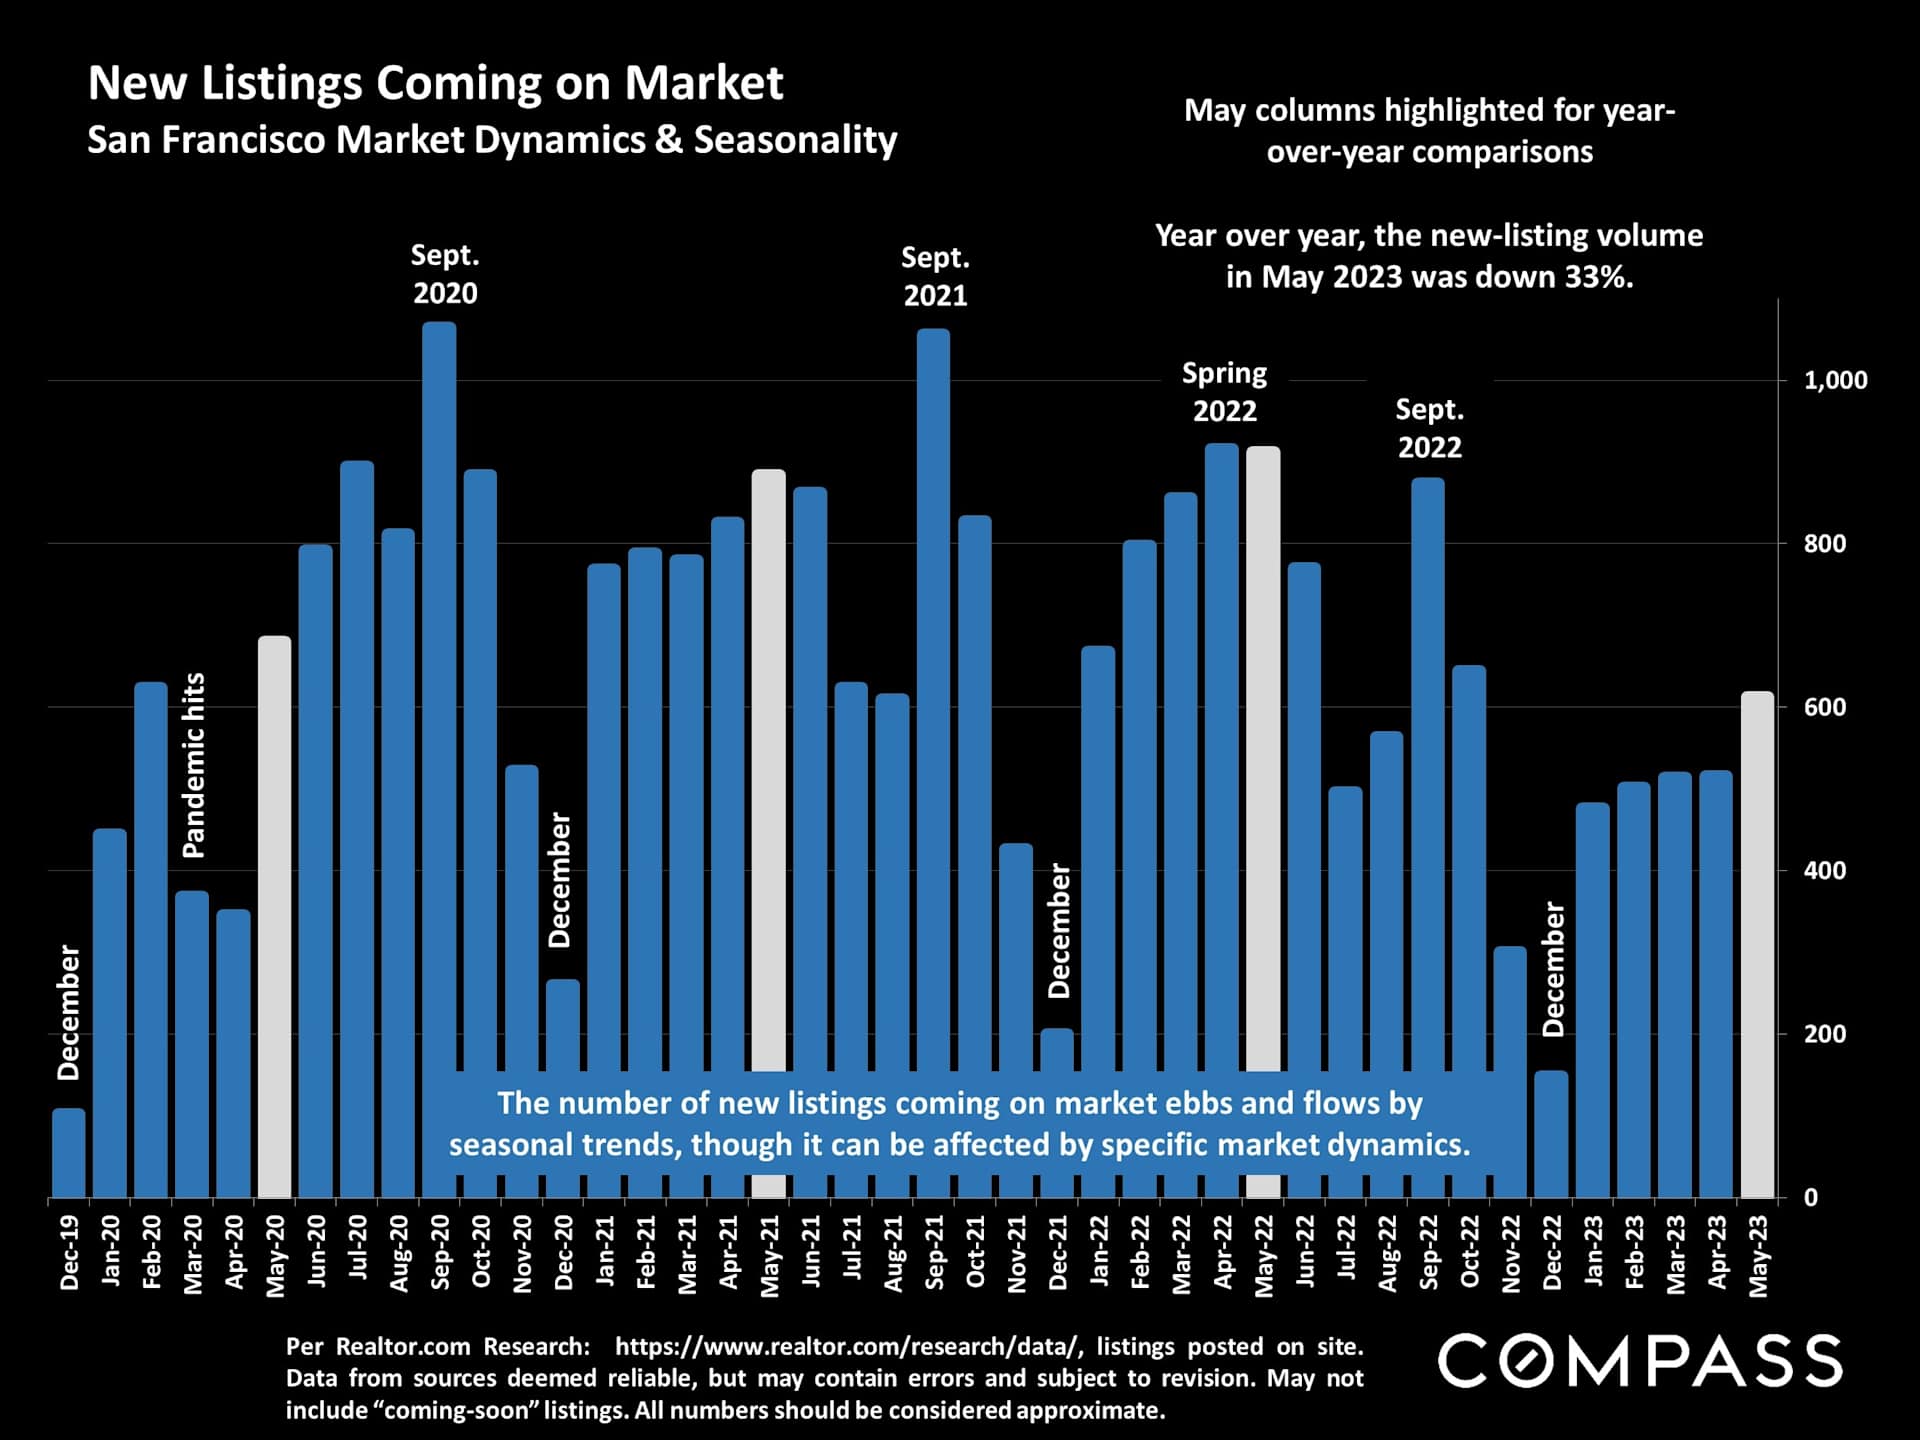
Chart of San Francisco monthly new listings from December 2019 to May 2023, with May 2023 down 33% year over year.

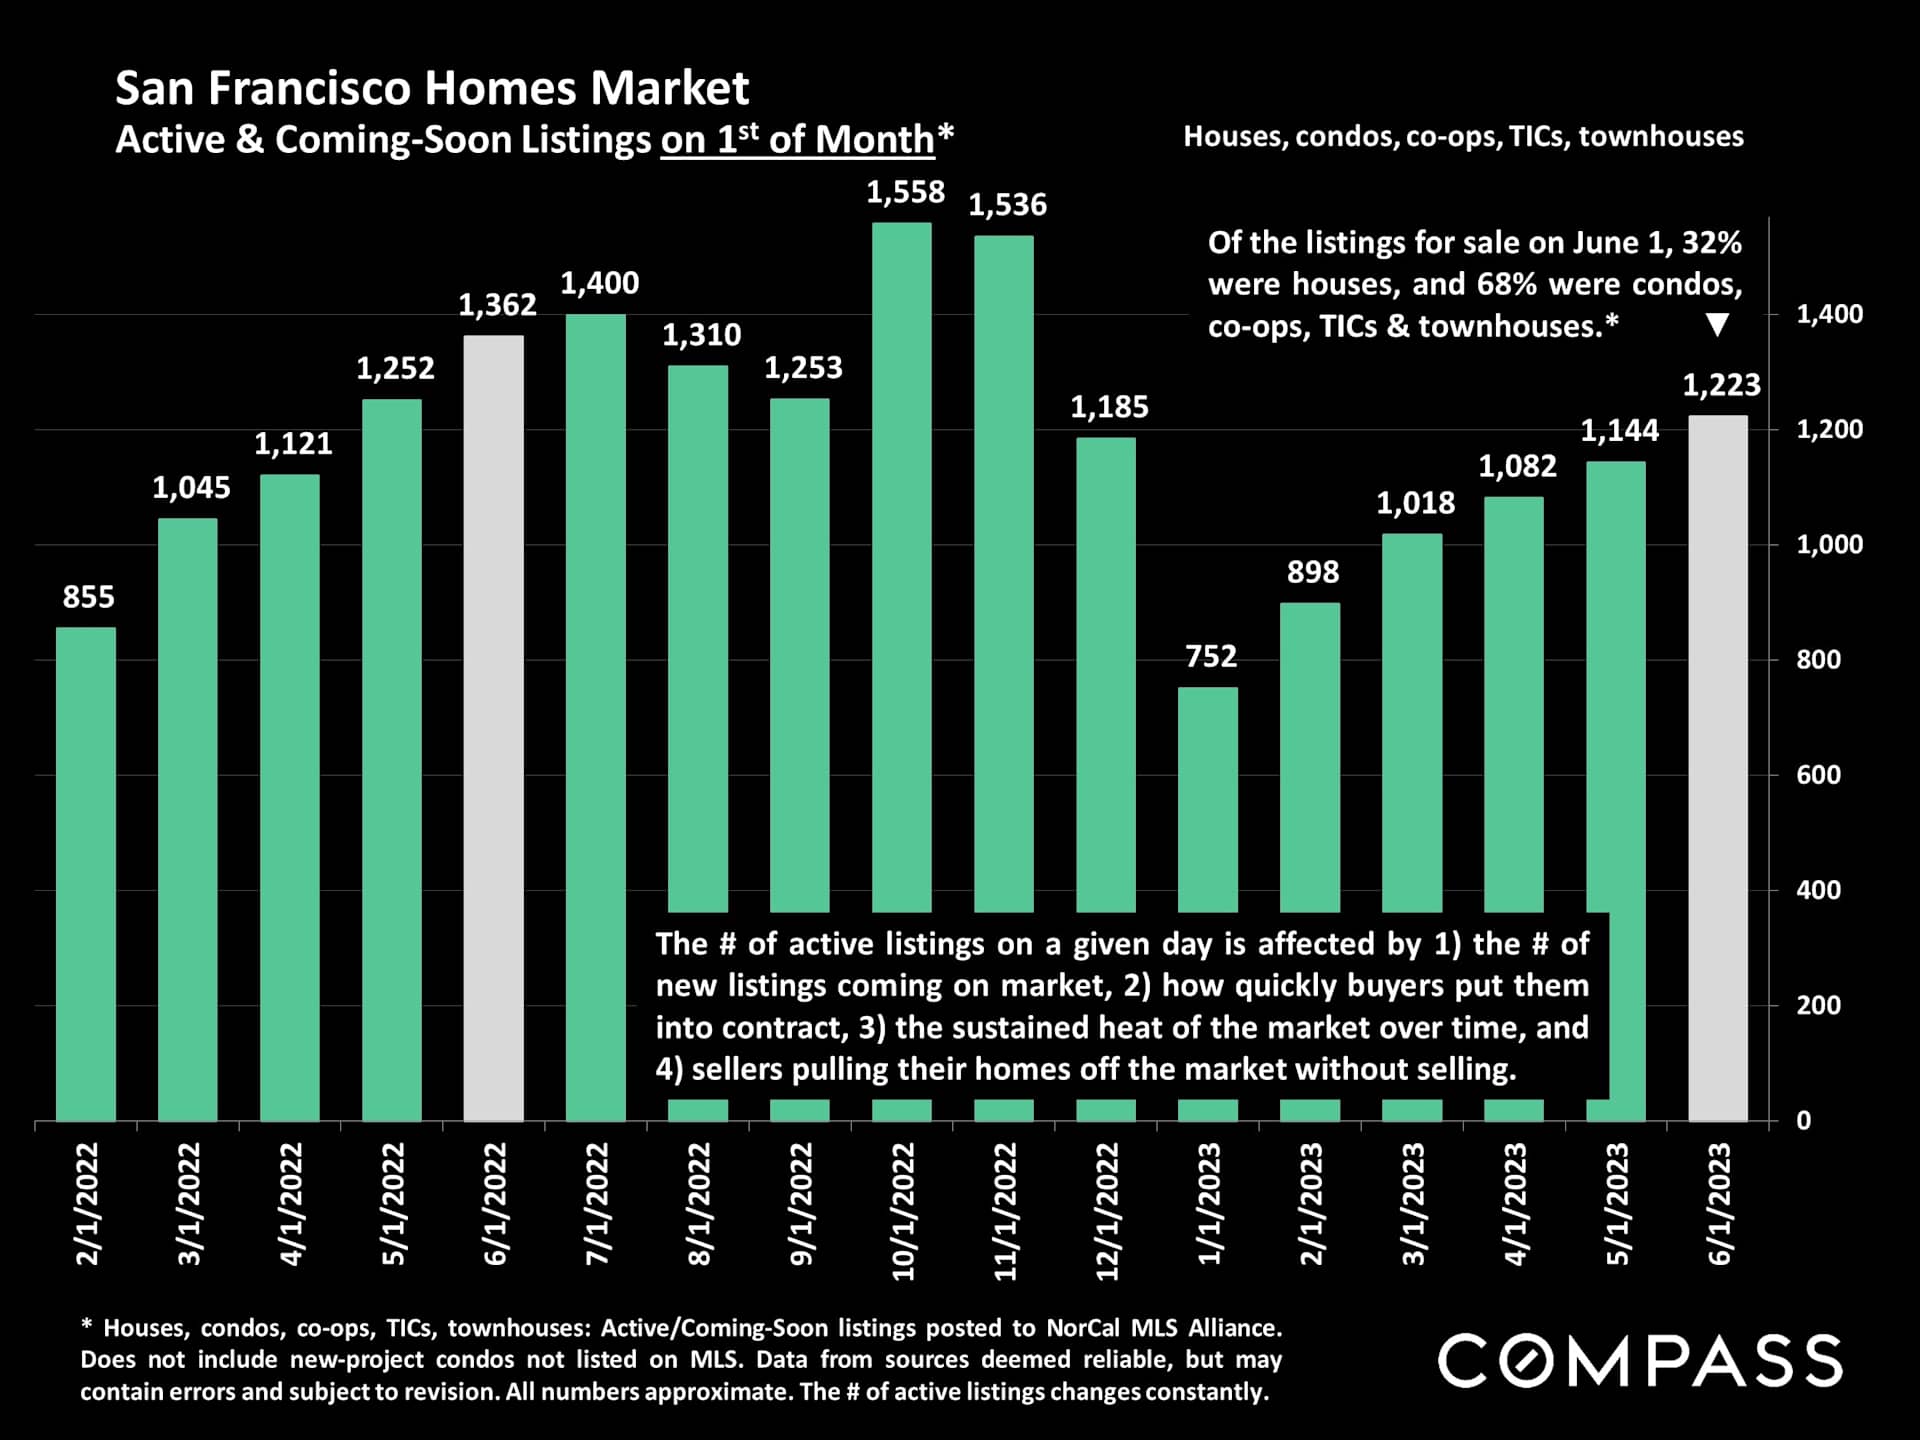
Bar chart of San Francisco active and coming-soon listings, February 2022–June 2023; June 2023 shows 1,223 listings.

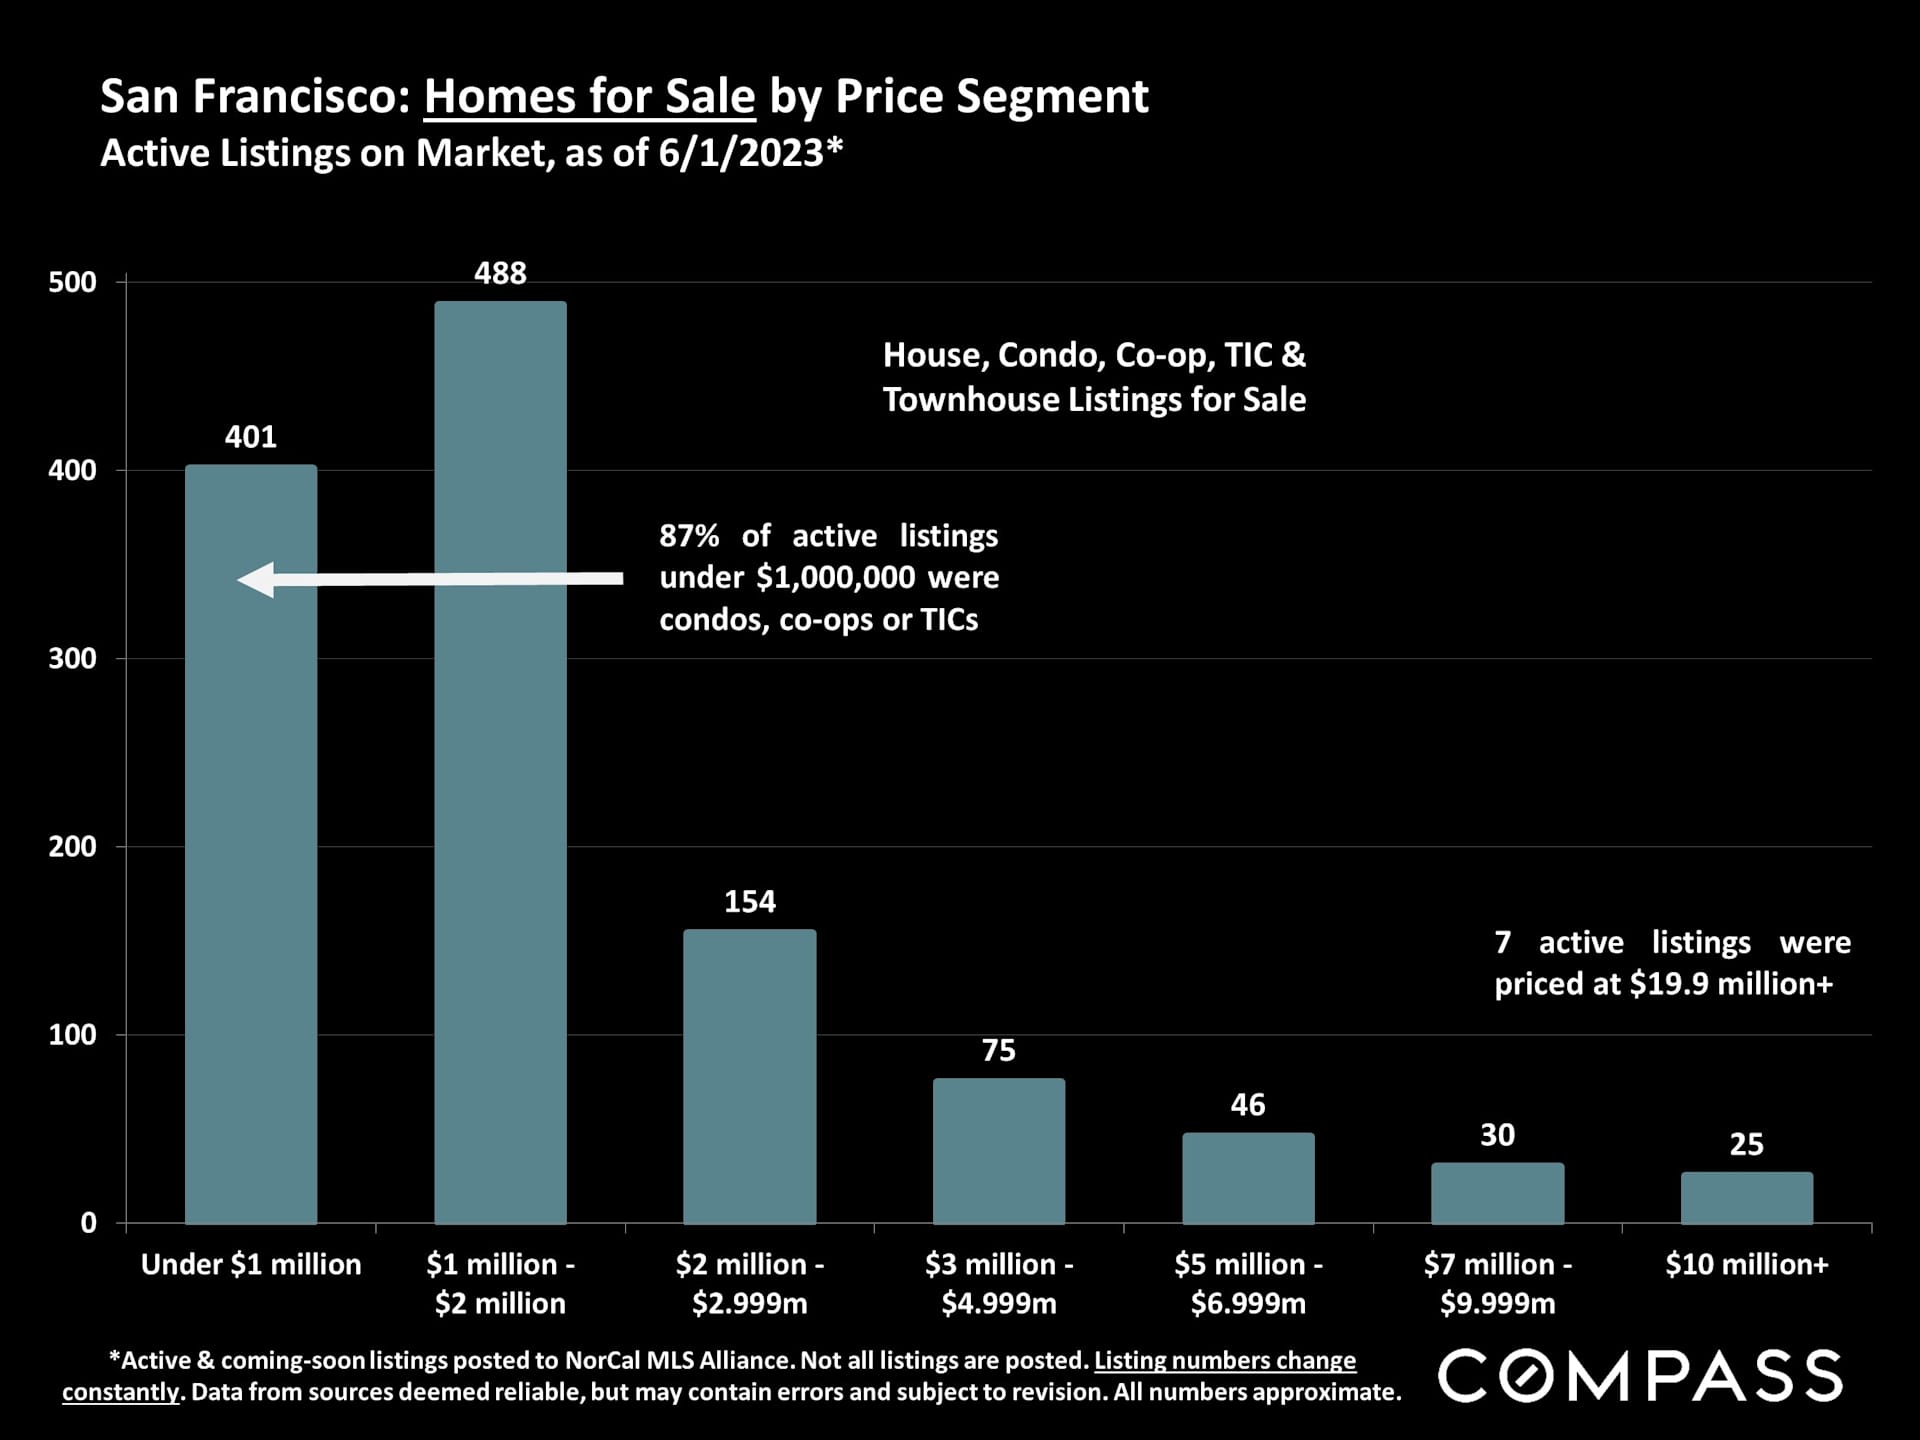
Bar chart of active San Francisco home listings by price segment, with the most listings priced at $1–$2 million.

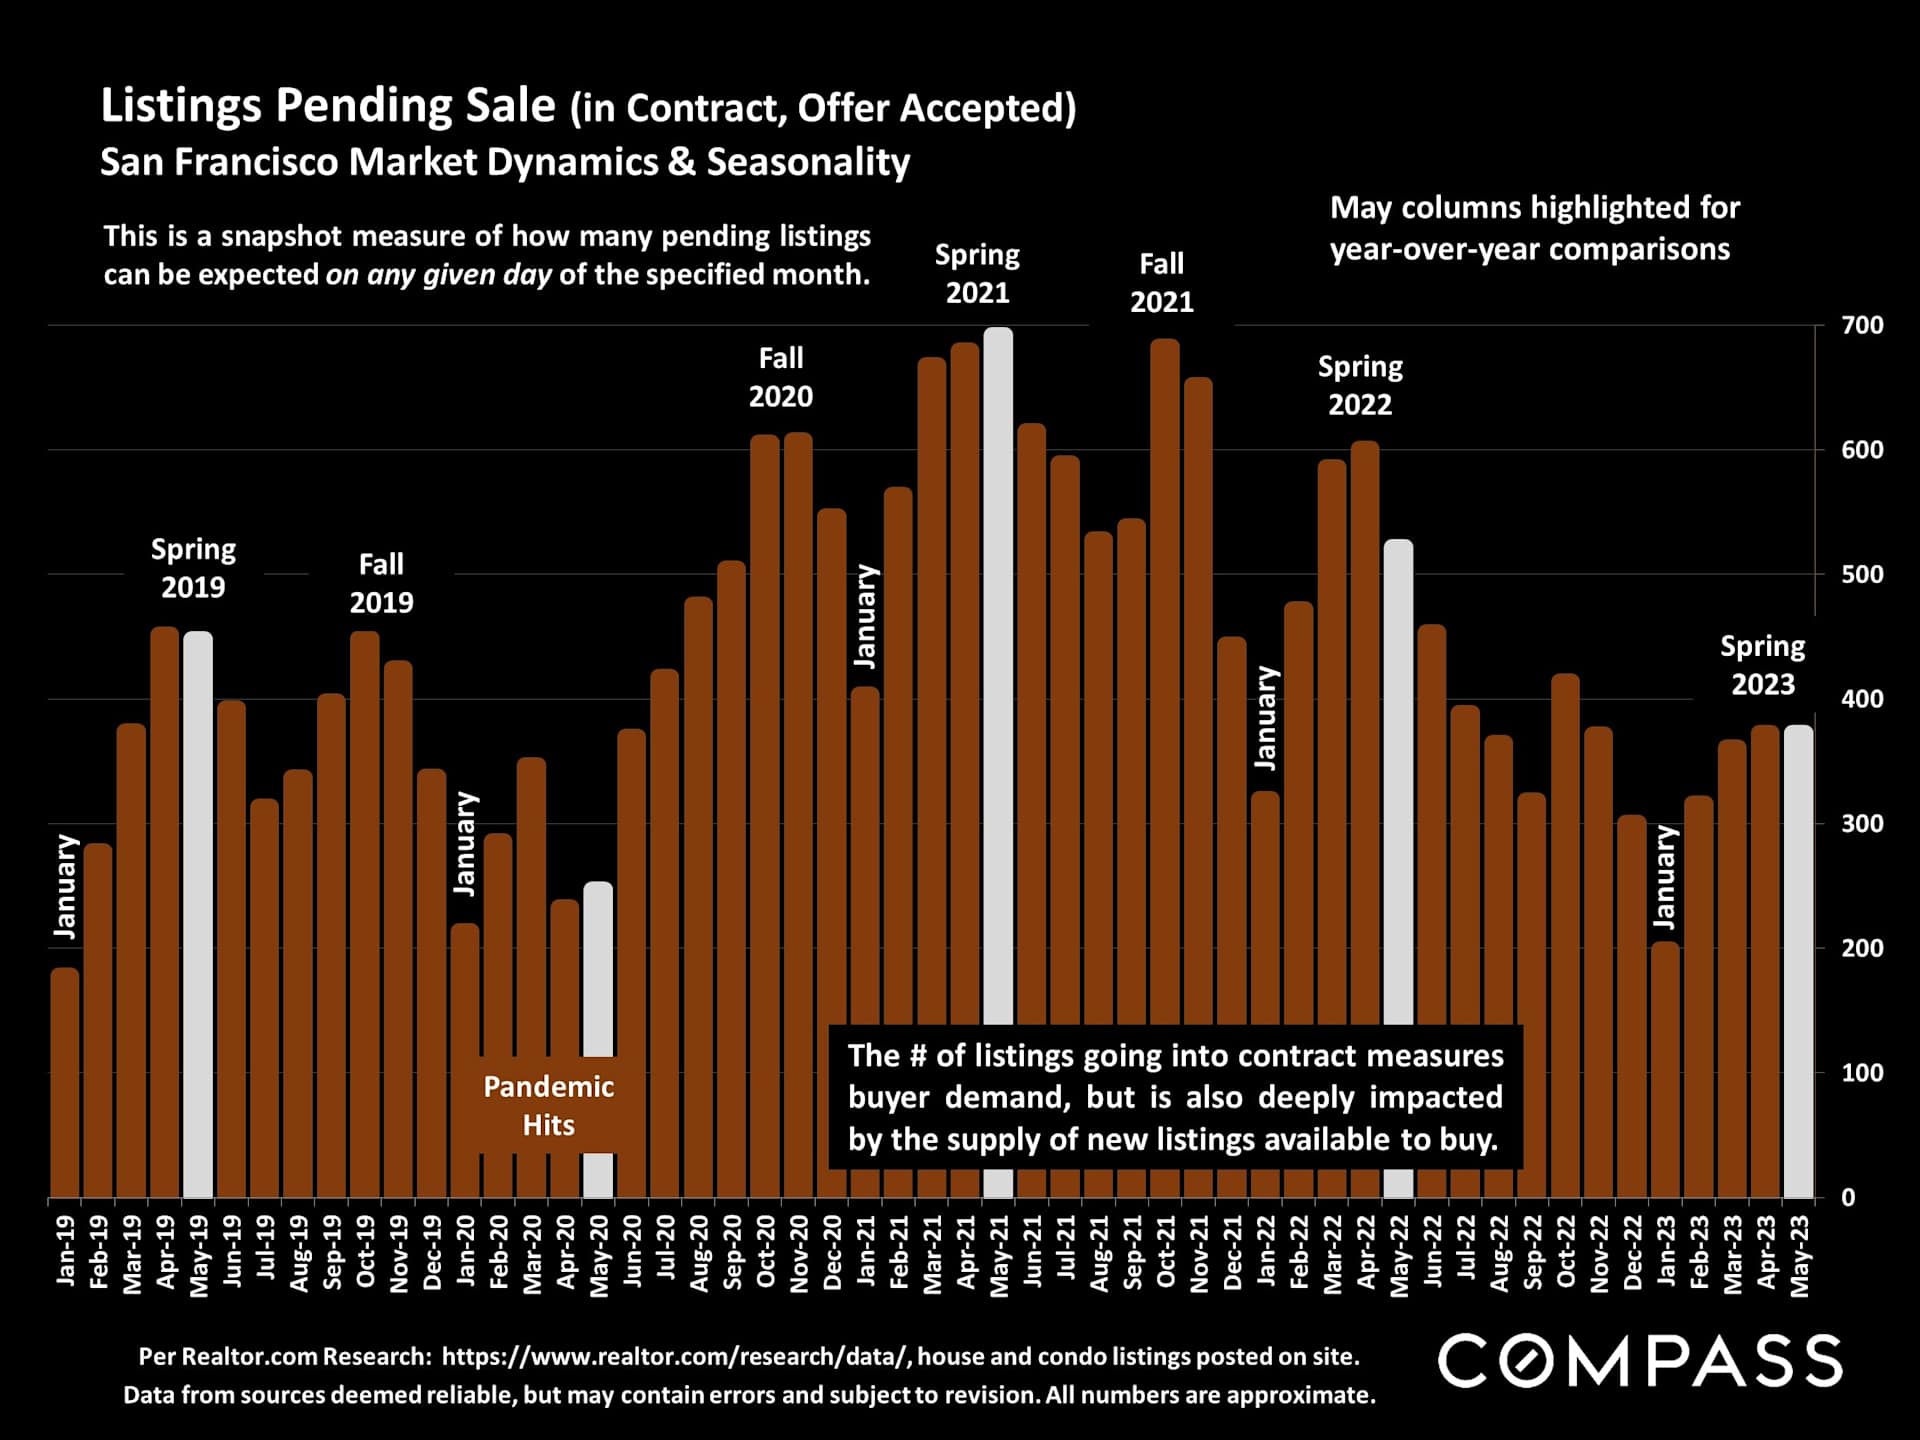
Chart of monthly San Francisco pending-sale listings, January 2019–May 2023, peaking in spring 2021.

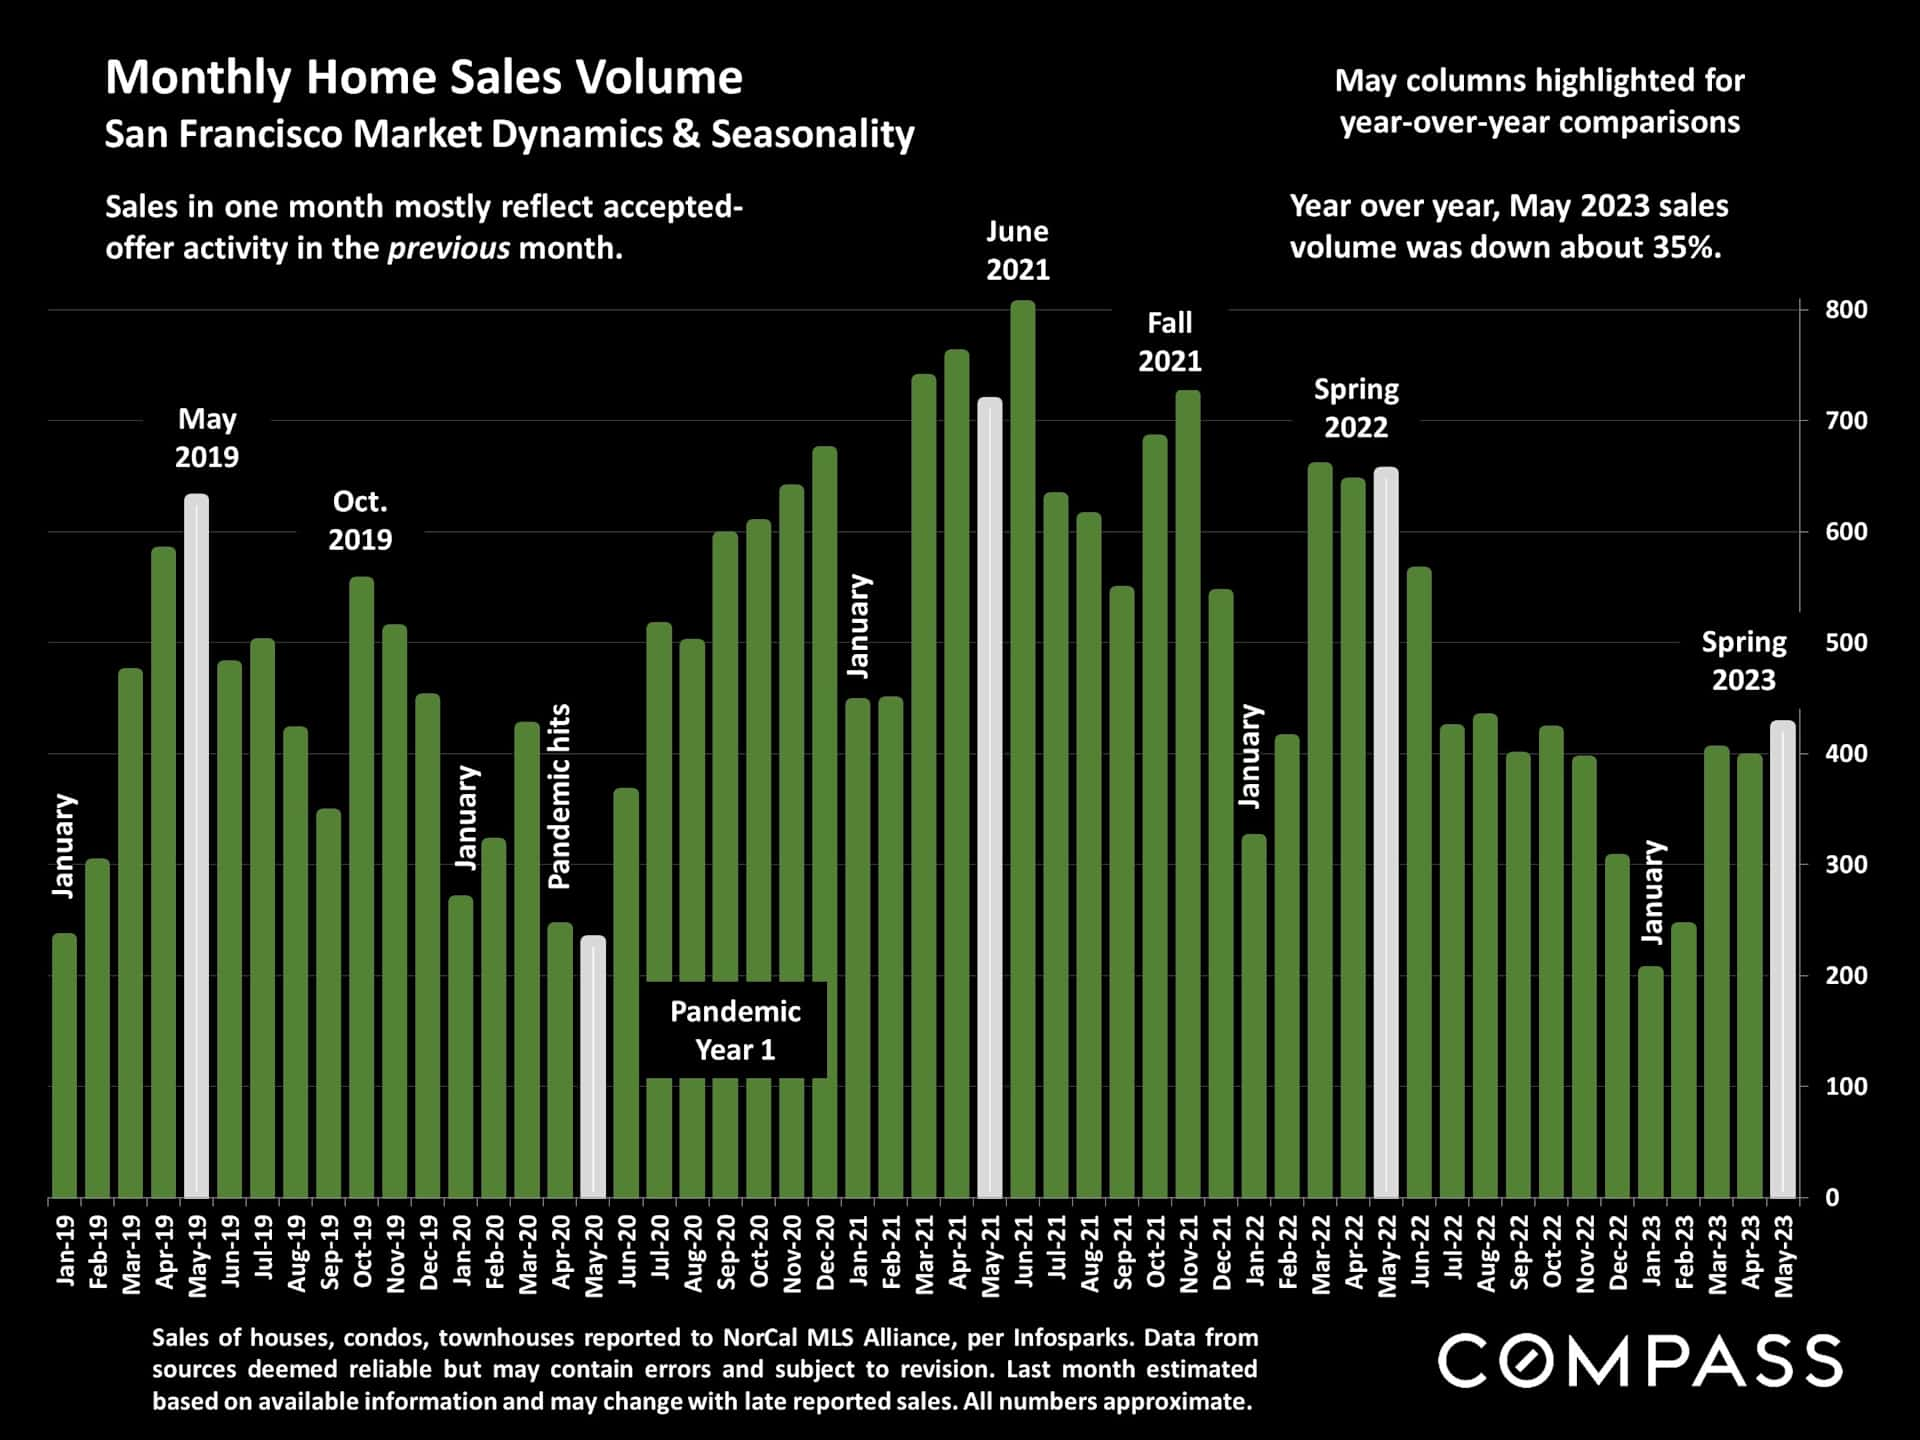
Bar chart of San Francisco monthly home sales from 2019 to May 2023, with May 2023 sales down about 35% year over year.

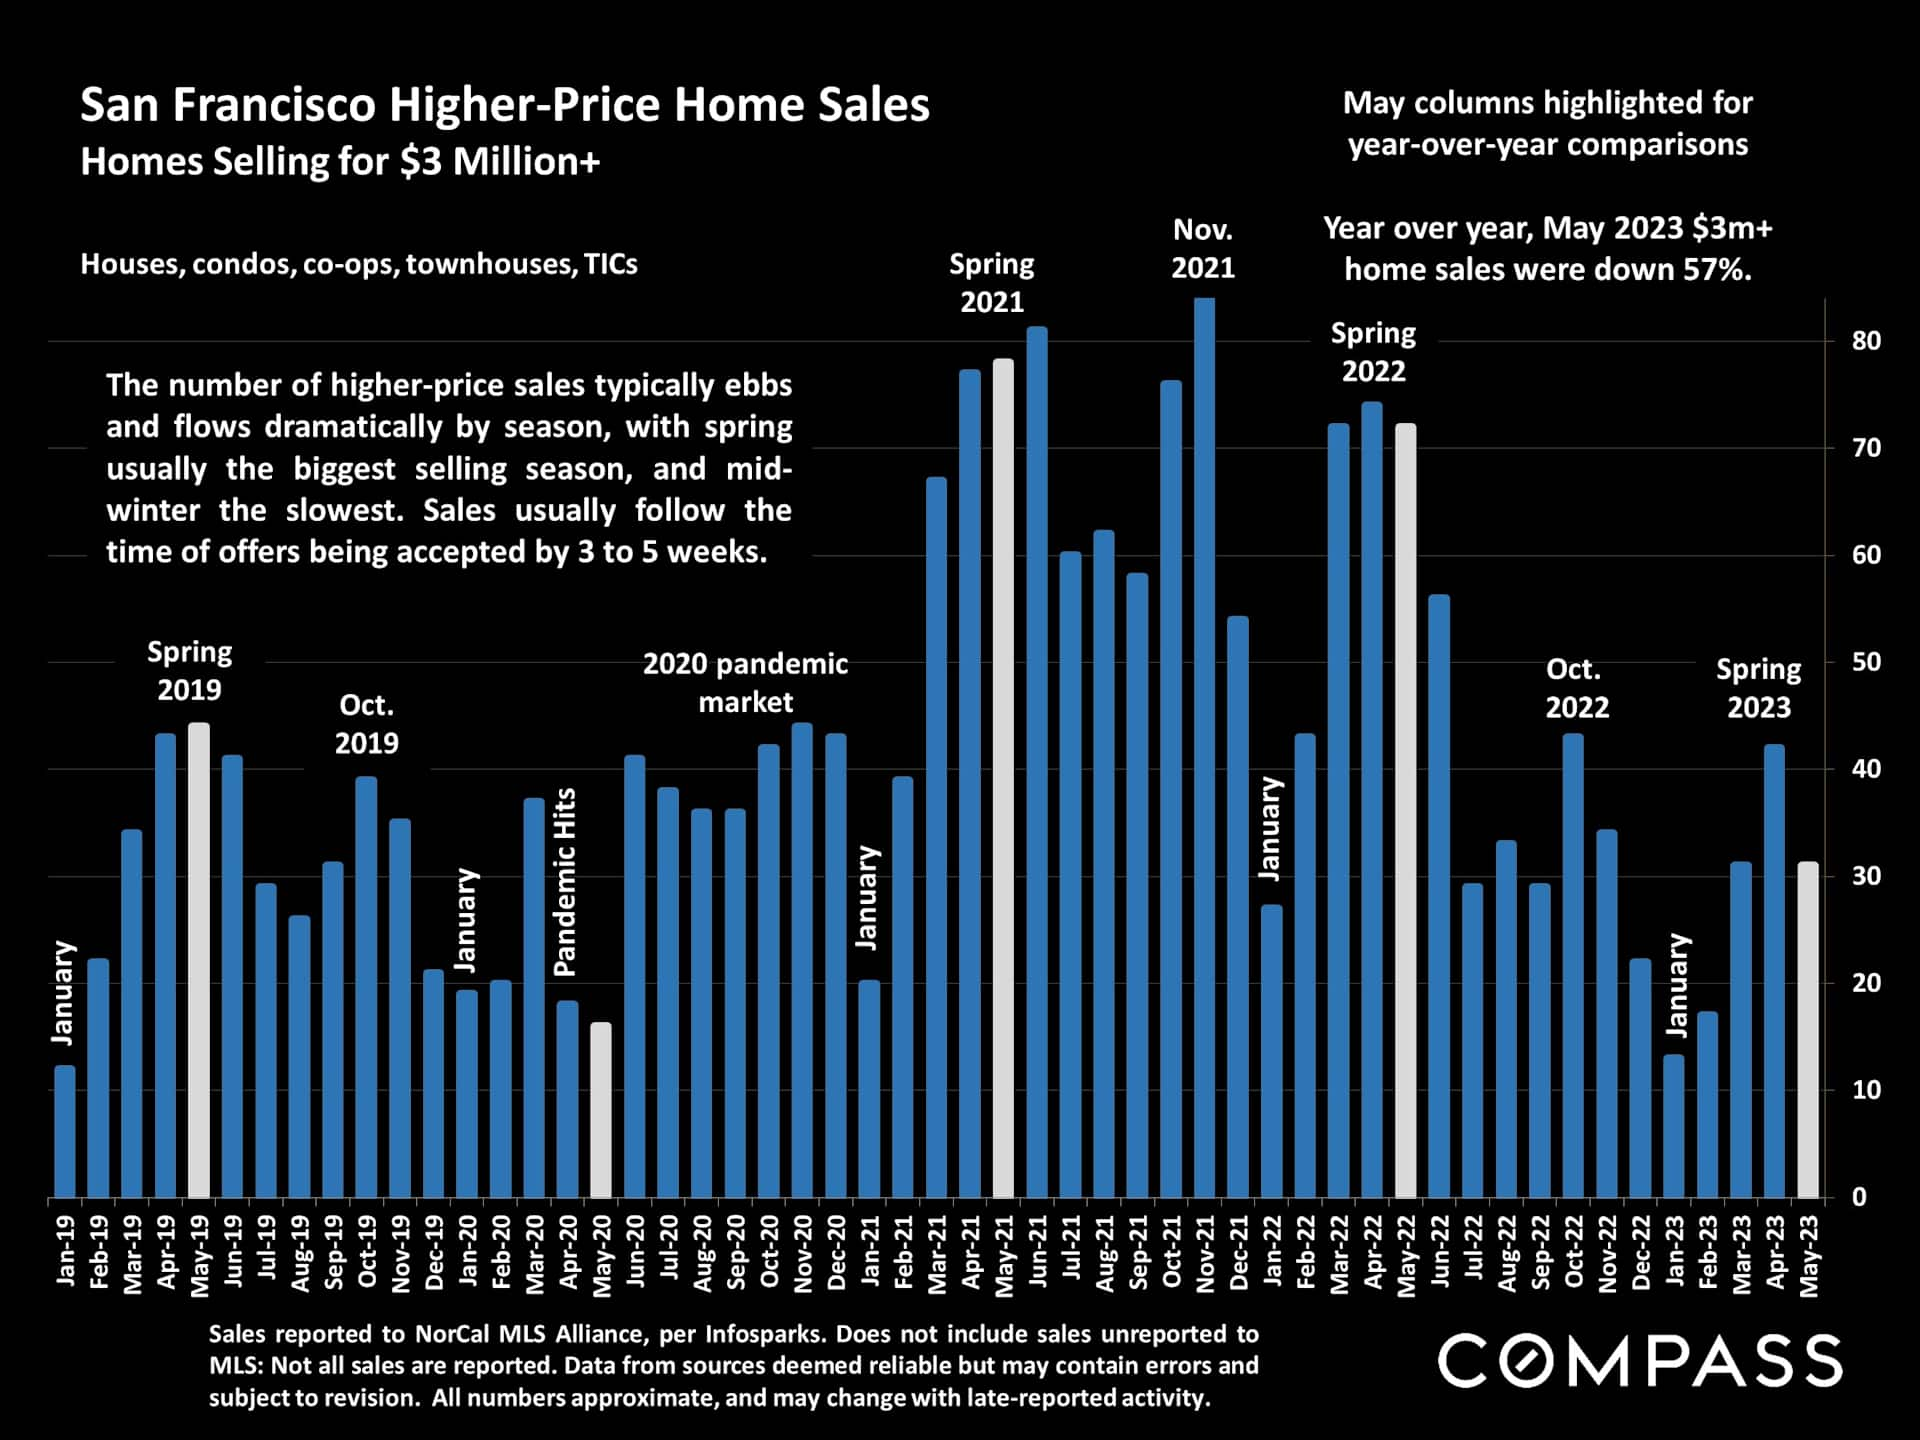
Bar chart of San Francisco $3 million-plus home sales from 2019 to May 2023, with May 2023 sales down 57% year over year.

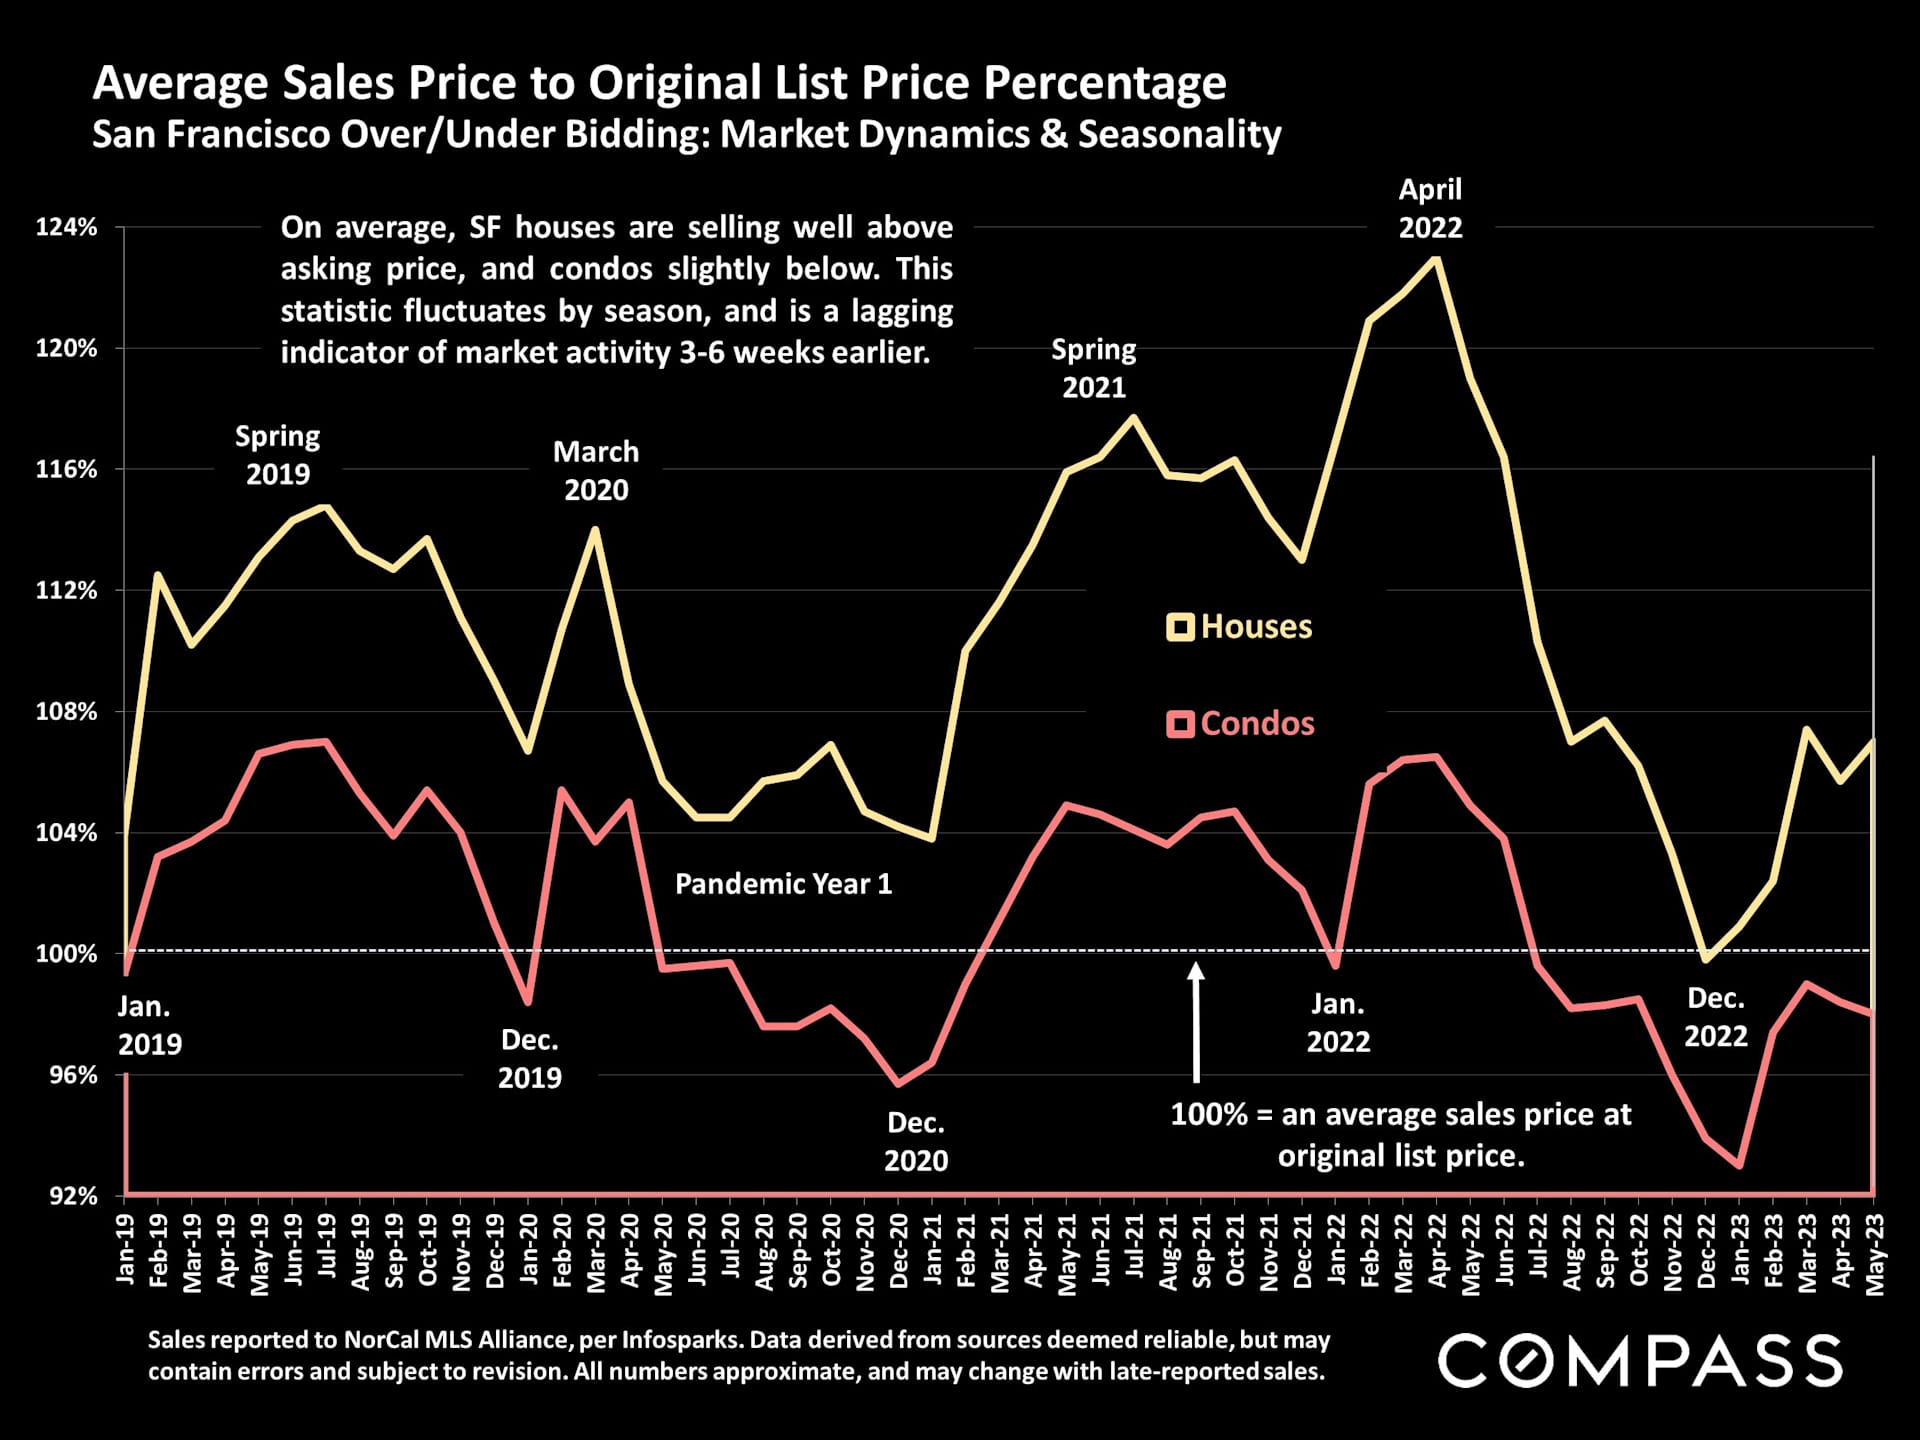
Chart comparing San Francisco house and condo sale prices to original list prices from 2019 through May 2023.

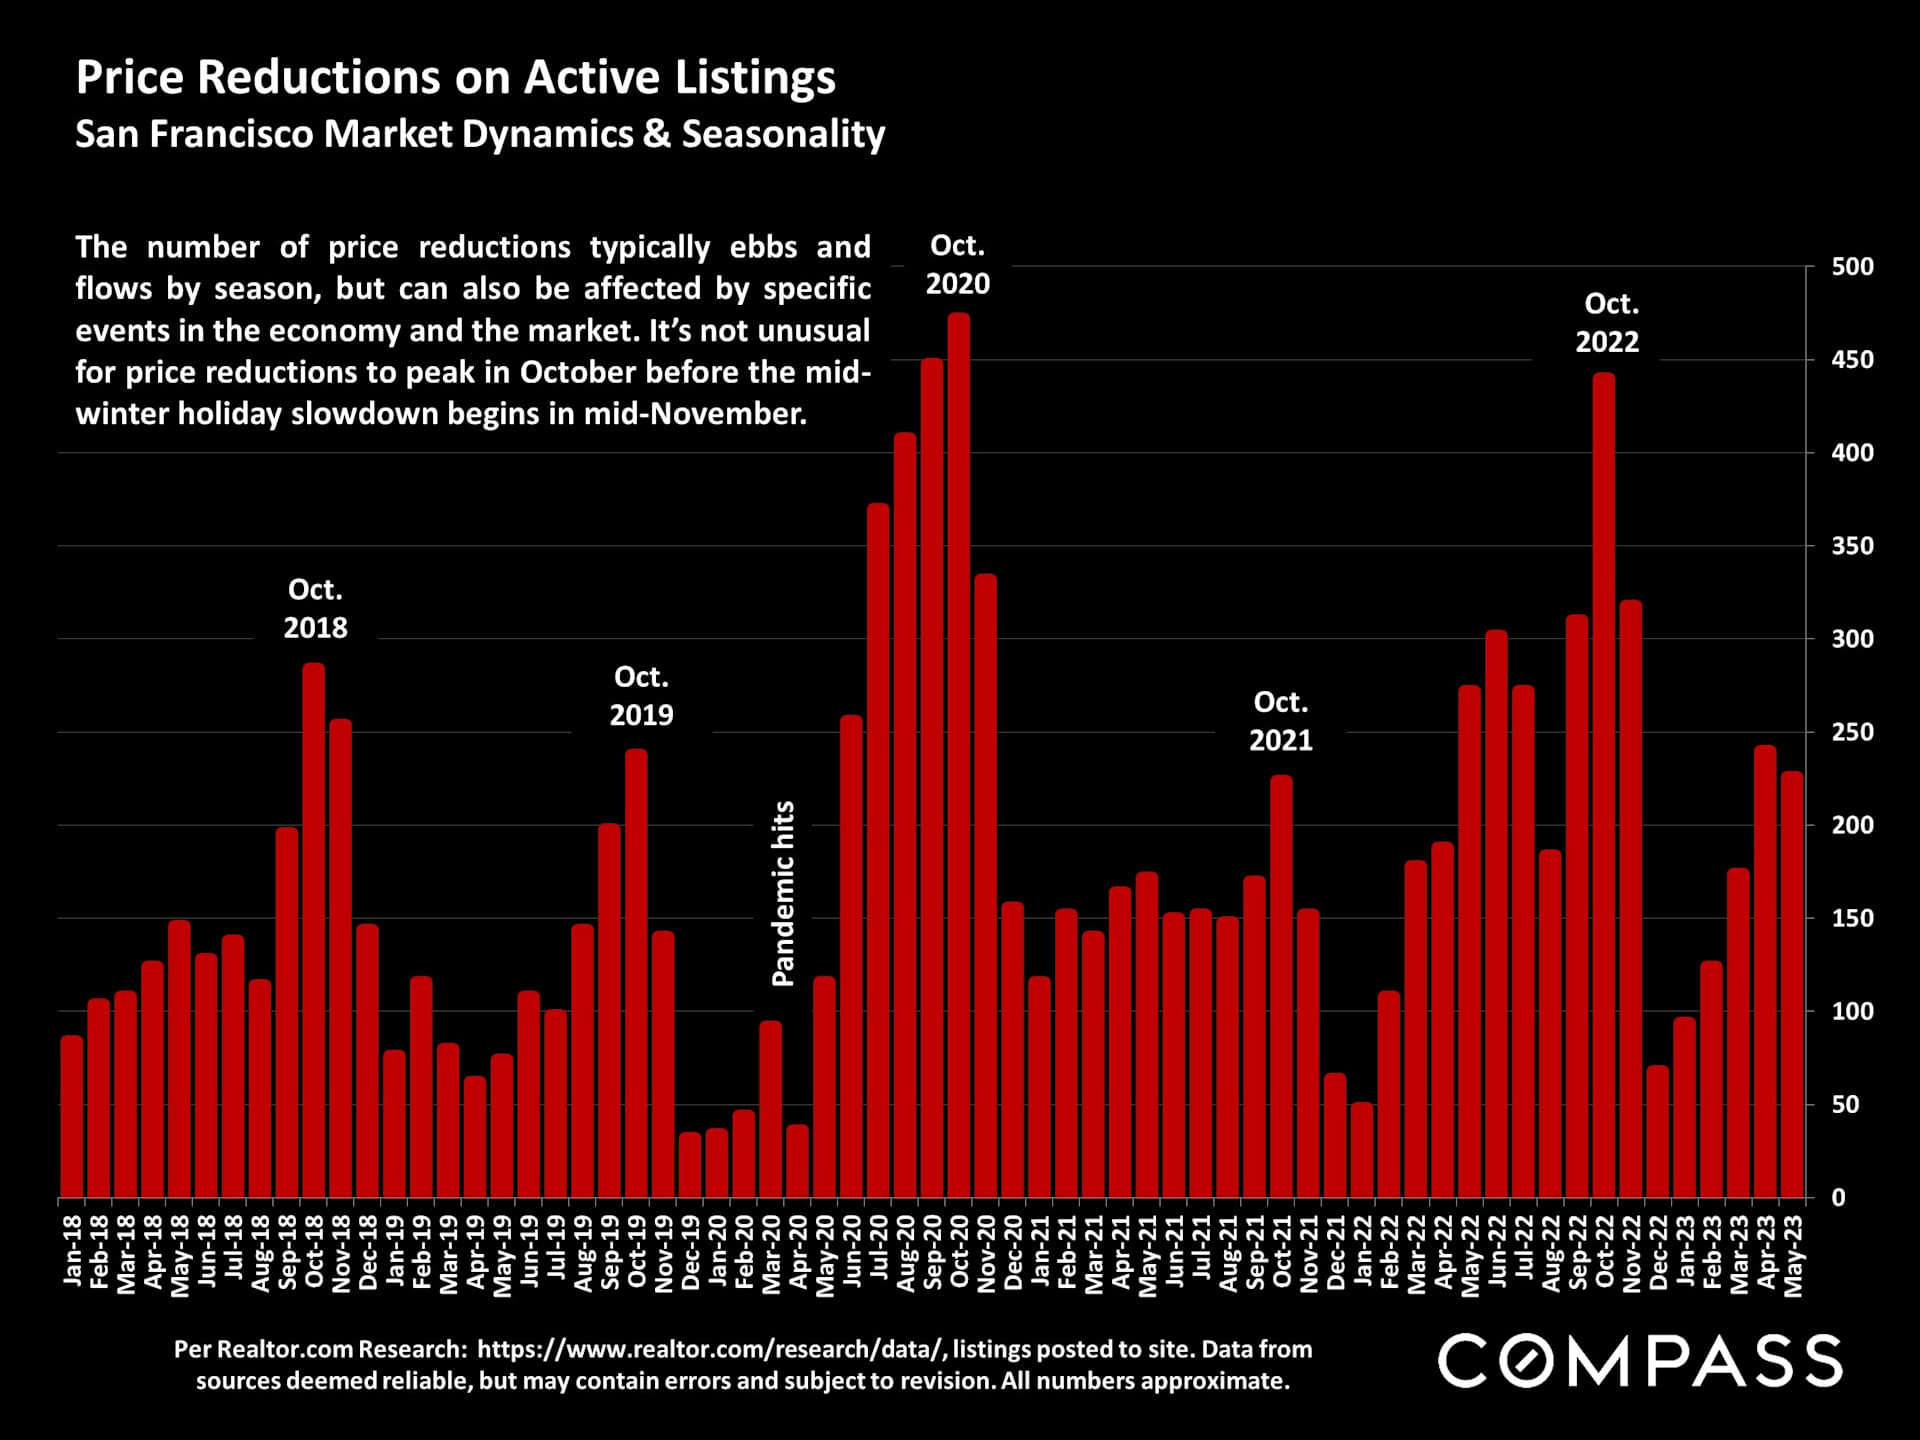
Bar chart of San Francisco listing price reductions, with October peaks from 2018 to 2022 and a pandemic-era surge.

Work With Jason

Through his experience in renovation and construction, Jason is skillful in advising his clients on taking measures to create additional value and equity through presenting cost-effective modifications or specific upgrades to the property.

Let's Connect